When Does Battery Storage Make Economic Sense for Solar Farms?
Understanding the Changing Economics of Solar Farms
In the midst of an energy transition, owning generation assets is not a set-and-forget proposition. In this blog I’m going to focus on solar farms. You can also watch the full video on this topic here if you’d like.
While PPAs and “bankable” power price forecasts may have shaped the project’s early revenue expectations, markets evolve quickly, and so should your strategy.
From falling capture prices, to shifting marginal loss factors, increasing curtailment by the system operator, the commercial performance of a solar asset can diverge quickly, and significantly, from original expectations.
For asset owners, this can mean regularly reassessing not just revenue outcomes, but the core levers available to improve them.
That might include:
- Revisiting offtake structures
- Evaluating the opportunity from merchant exposure
- The role of co-located battery storage, to capture value from volatility, mitigate curtailment - both economic and physical - or unlock new revenue streams.
Knowing when and how to adjust strategy is now central to maximising long-term asset value. In this piece I’m going to step through what this might look like for the owner of a solar farm in Australia’s NEM. This is a market with around 10GW of utility-scale solar and over 20GW of roof-top solar, and, and this is not a coincidence, it's a market with a huge amount of negative wholesale pricing.

The Growing Challenge of Negative Wholesale Pricing
Before we get into the model it’s worth a quick look at how market pricing has evolved in Australia over the last few years, particularly in the context of solar farm owners.
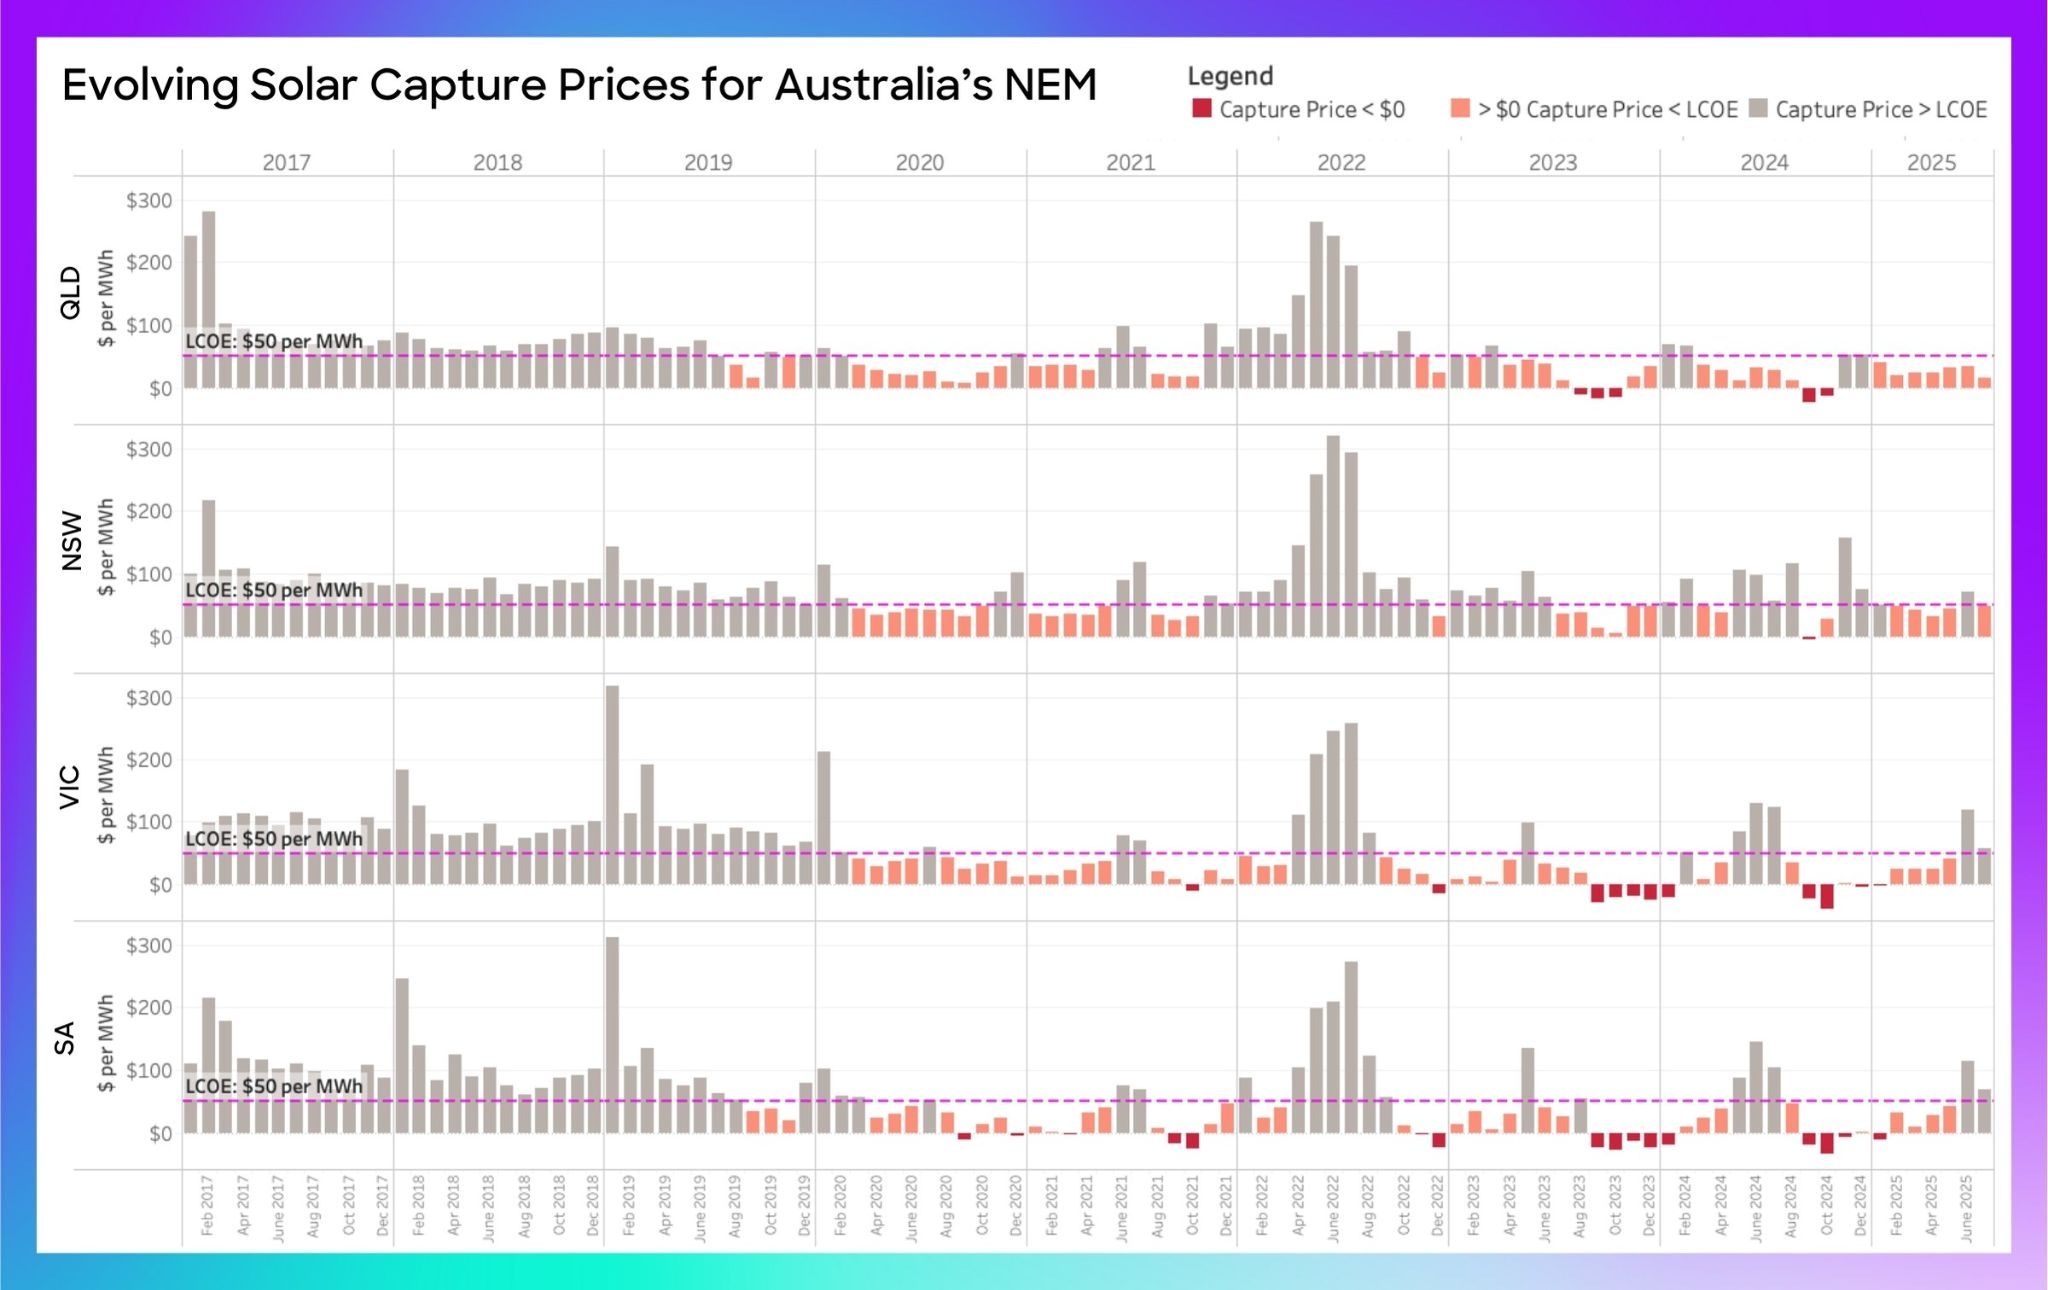
Solar capture prices, the volume weighted average price for utility-scale solar generation in the wholesale market, have been falling steadily over the last few years. In most regions it’s now regularly lower than the cost of producing that energy - reflected here as LCOE and shown on the chart in pink - and in some months is even negative, shown in red.
How Curtailment Impacts Solar Asset Revenues
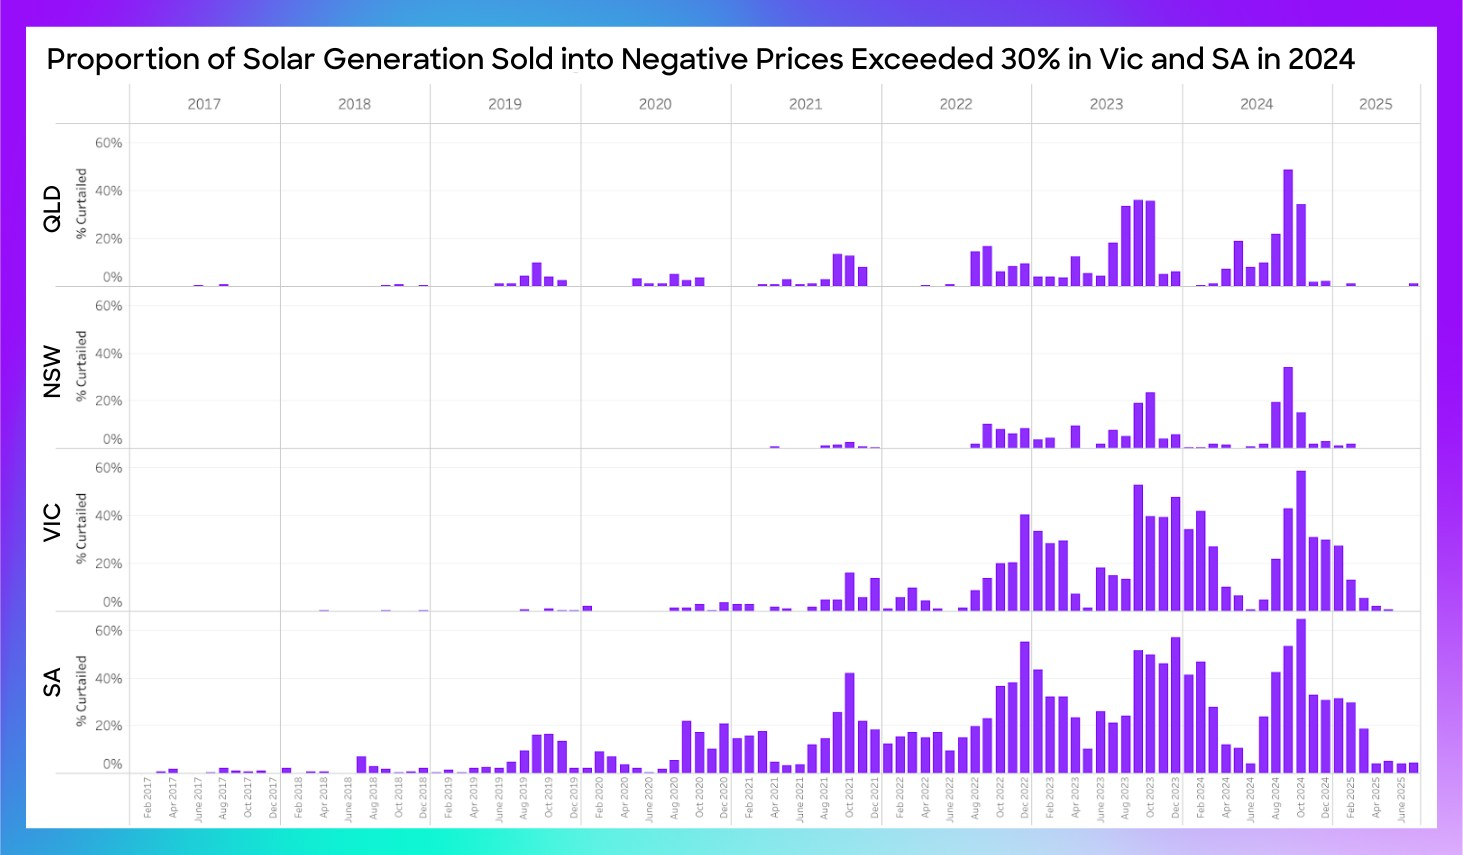
That in turn drives the need for economic curtailment, meaning asset owners turn generation down or off to avoid selling at a loss. Looking at the volumes of solar generation that occur during periods of negative pricing over the last few years, the trend is clear.
In fact, in 2024 over 30% of all generation from Victoria and South Australia occurred when wholesale prices were negative, with October 2024 hitting over 60%.
Whilst asset owners might not have direct exposure to wholesale prices, they underpin off-take negotiations and most PPA contracts will now include negative pricing clauses.
Rethinking Offtake Structures and PPA Exposure
So, what might a solar farm owner do about it?
To explore that question we’re going to use a real solar farm in Victoria as our modelling lab rat. In this case it’s Glenrowan, a 130MW asset located next to the Hume Freeway north of Melbourne.
In real life Glenrowan has a 10 year PPA with the Victorian government, details of which are not publicly available, but for this exercise we’re going to assume it’s market exposed. You might consider this “fair value” for the asset owner.
So the solar farm will earn the wholesale price plus LGC revenue, in this case at $40 per certificate. We’re modelling the last 12 months of performance, from 1 August 2024 to 31 July 2025.
The Case for Adding Battery Storage to Solar Assets
In our baseline scenario we’re going to use the actual output from Glenrowan for the last 12 months. To do this we’re using the Feeds feature within Gridcog, which automatically collects data on operational asset performance, in this case from the system operator.
This is useful, but it only tells us what the solar farm exported to the grid after any economic or physical curtailment, not what it was actually capable of producing.
It’s the available generation that we need if we want to properly understand the impact of curtailment and the upside potential of adding storage. So for scenario two we’ll model that.
This time rather than using the actual generation we’ll use the solar asset within Gridcog, configured to match the physical specs of the actual solar farm, to create a modelled output.
We benchmark and calibrate our models all the time and in this case we’re within about 2% of AEMO’s published data.

Next we’re going to add some storage, simulating the addition of a 50MW battery.
In fact we’re going to test a couple of durations, looking at both 2-hour and 4-hour, and for each battery size we’ll also model the upside from the ancillary markets, using current settings for market saturation and, in the case of the regulation markets, for energy utilisation.
For the BESS dispatch we’re assuming perfect foresight for now, although we could include short term forecast uncertainty into the simulation if we wanted.
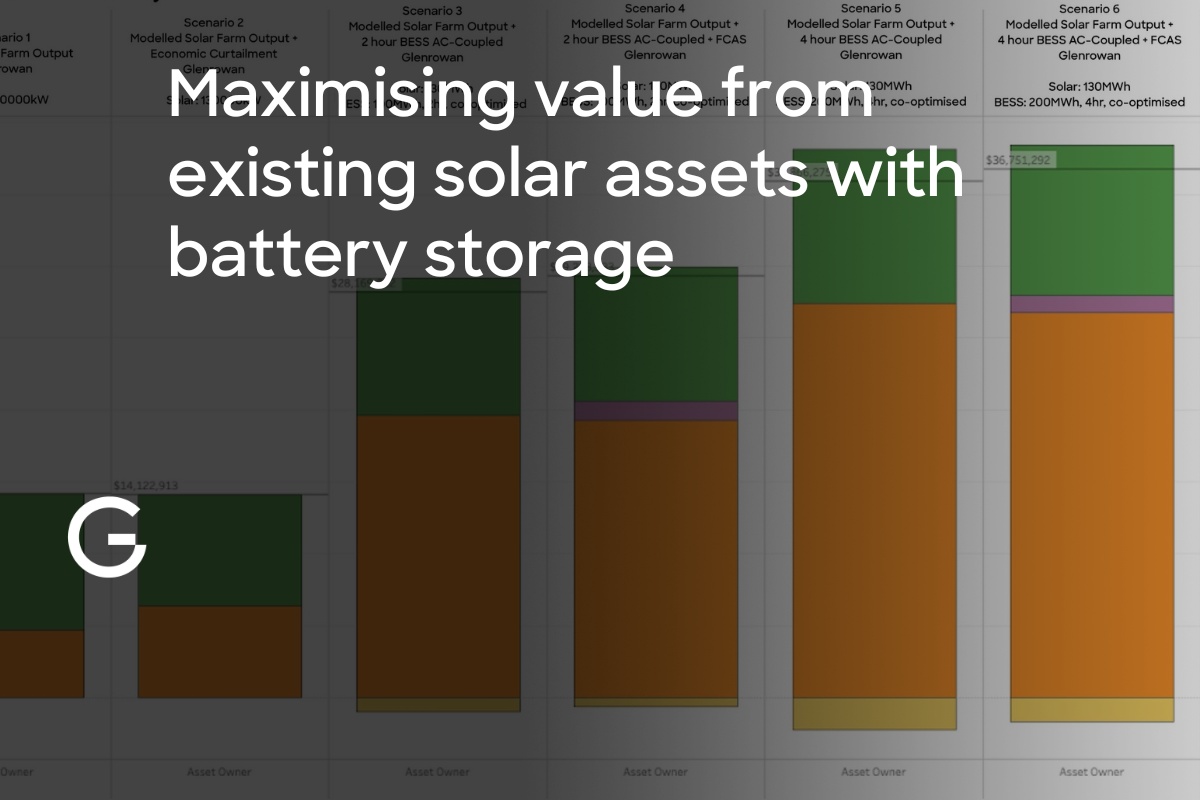
Looking at the modelling results, we estimate the actual asset would have generated revenues of about $14m over the last 12 months, with the majority of that coming from LGCs.
Adding a 2-hour battery would have doubled that revenue over the last 12 months, and that includes a 4x increase in wholesale revenue.
Adding ancillary services adds a modest 5% additional revenue, a reflection of the heavily saturated FCAS market conditions currently at play in the NEM.
.jpg)
Unlocking Value Through Ancillary Services Markets
What this analysis illustrates is that planning for a solar asset isn’t a one-time job. Whether it’s falling capture rates, increasing physical curtailment or changes to policy or market settings, the need for review, re‑test, and re‑optimise is stronger than ever.
At the same time, grid connection capacity is becoming one of the most valuable and limited resources in the energy transition.
Why Grid Connection Capacity Is a Critical Asset
If you’ve secured a connection, making the most of it matters. That means maximising utilisation, improving revenue per MW, and ensuring your asset can flex to the market, not just feed into it.
With Gridcog, you can model these trade-offs and opportunities as they emerge. Reach out to the team if you’d like to learn more.
Watch the full video on this topic here:


