

How Solar Curtailment Has Changed Across the NEM Since 2020
Solar assets across Australia's National Electricity Market (NEM) are being curtailed at levels that would have been unthinkable in 2020 - and where an asset sits on the grid now matters as much as the price it can secure. Using five years of five-minute constraint and bid data across roughly 40 mainland NEM solar assets operational since 2020, this deep dive breaks down how curtailment has evolved by region and by individual asset, and what that means for anyone modelling future solar revenue.
What is solar curtailment, and why does the cause matter?
Curtailment happens when a solar asset generates less than it's physically capable of. In the NEM, that lost generation splits into two distinct causes:
- Economic curtailment: the asset chooses not to sell because the wholesale price has fallen below its asking price.
- Network curtailment: physical network constraints limit how much of the available power can actually be exported to the grid.
The distinction matters for revenue modelling because the two causes respond to completely different levers - price forecasting won't tell you anything about network constraints, and vice versa.
One important nuance: when economic curtailment and a binding network constraint happen at the same time, the lost generation counts as economic, not network. An asset can't lose grid access to energy it was never planning to offer in the first place. This is why regions with heavy economic curtailment, such as South Australia, show almost no network curtailment - the assets were already sitting out of the market.
Curtailment has risen sharply across every NEM region since 2020
Comparing curtailment as a share of available generation in 2020 against the last 12 months shows a clear trend: every mainland NEM region has seen a substantial increase.
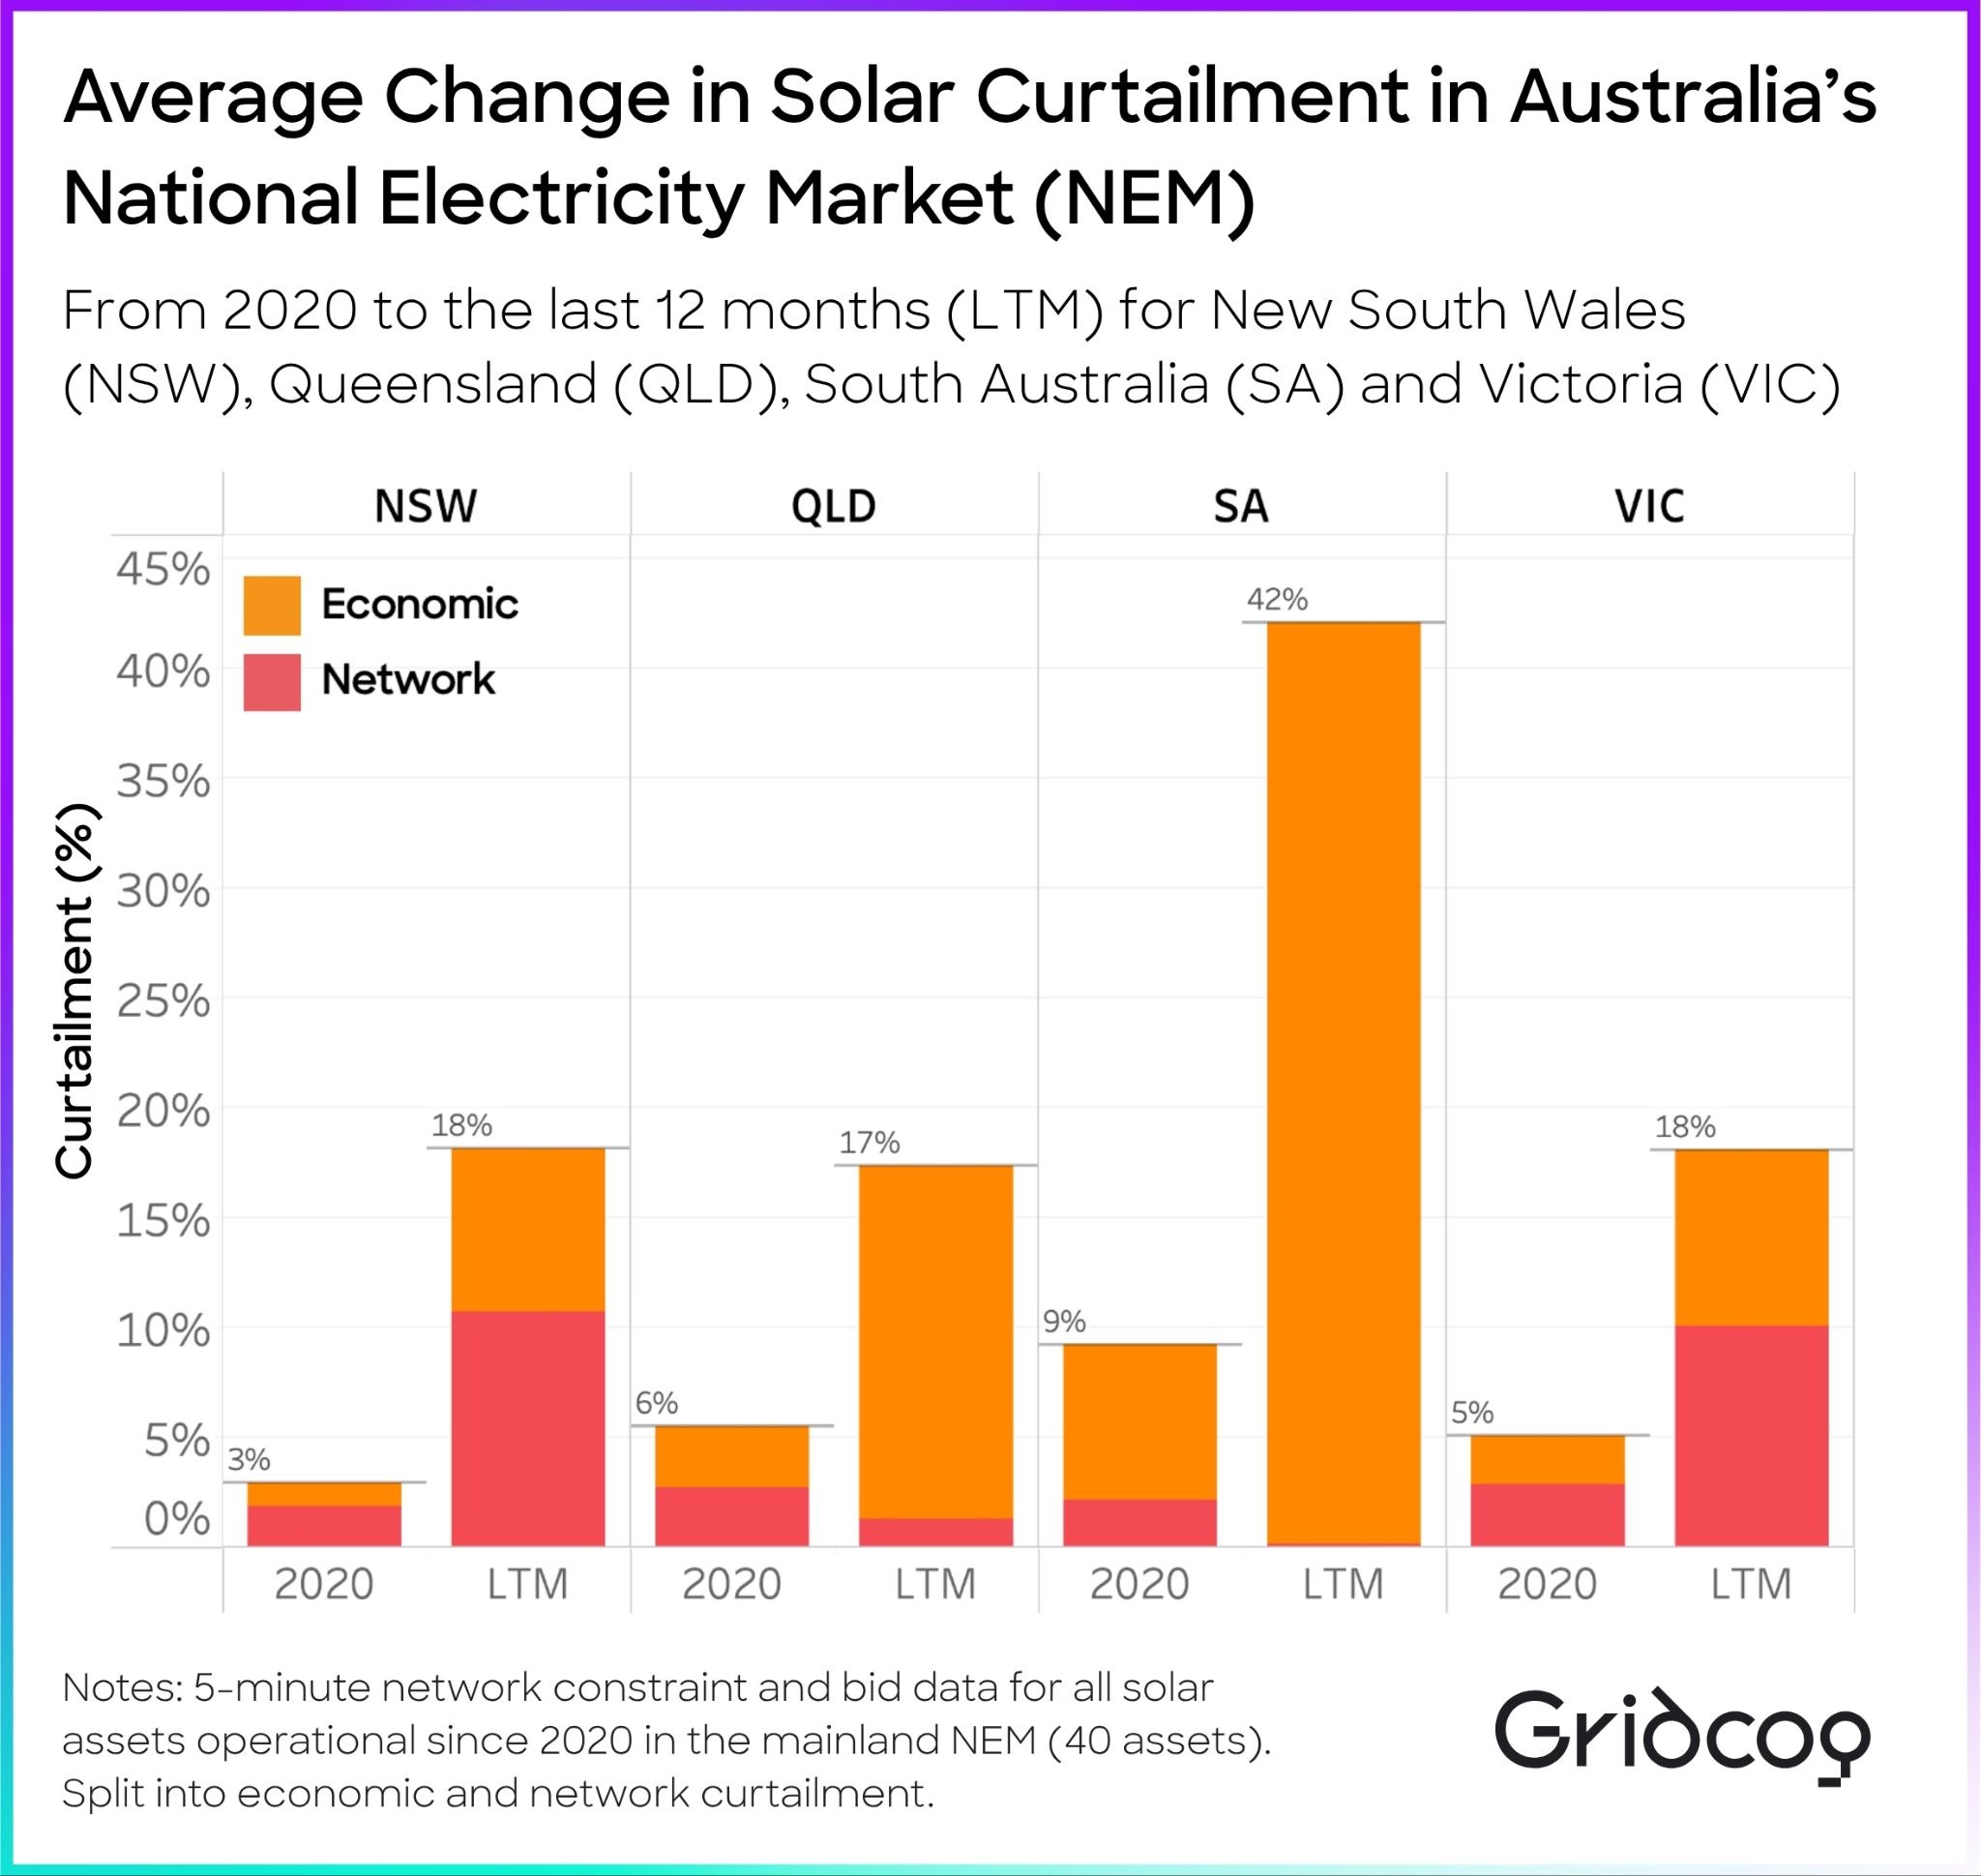
South Australia now leads on total curtailment, with 42% of available generation curtailed - almost entirely for economic reasons, driven by increasingly deep and frequent negative prices.
New South Wales has seen the sharpest relative rise, with total curtailment up sixfold since 2020. NSW also leads the network side of the equation, with around 11% of available generation curtailed due to network constraints over the last 12 months.
Asset-level data shows the fleet splitting in two directions
Regional averages only tell part of the story. Looking at curtailment at the individual asset level reveals a fleet that has fractured since 2020.
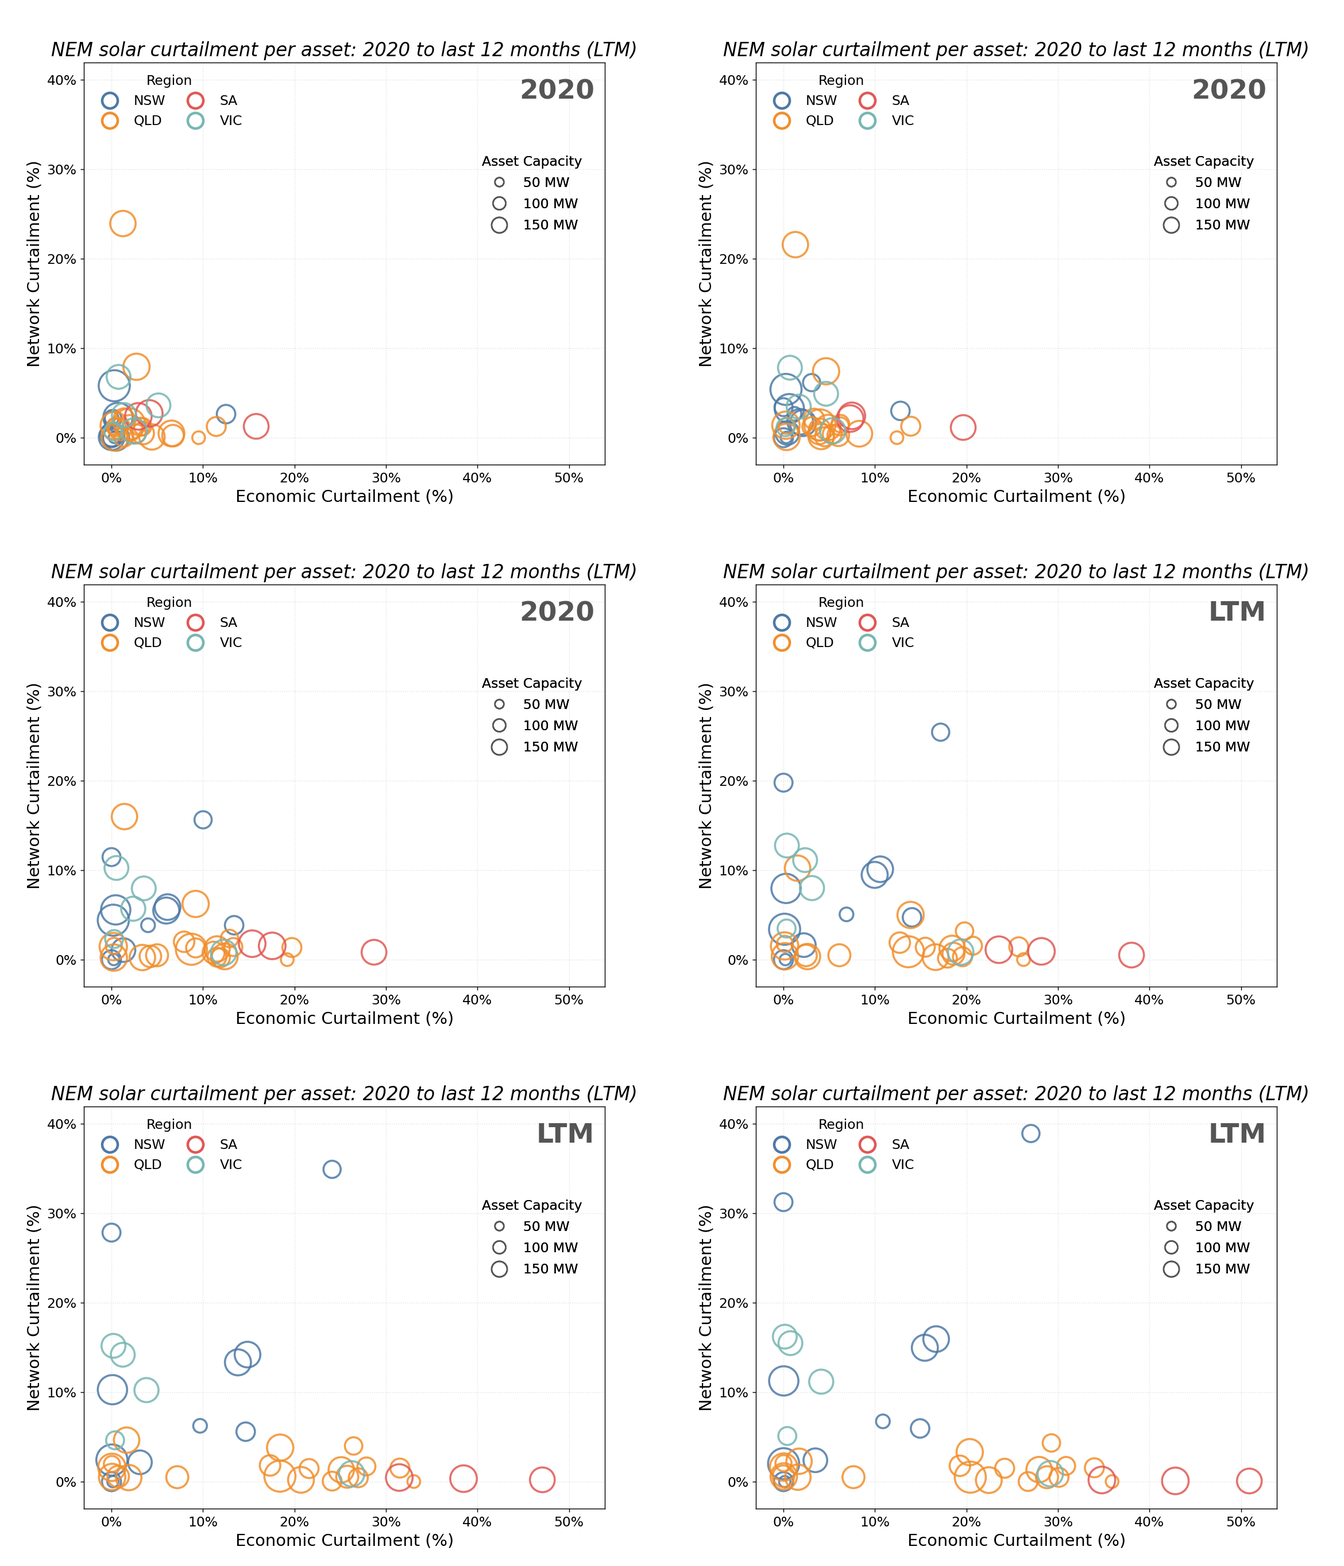
In 2020, over three-quarters of solar farms sat in a single low-curtailment cluster, each losing under 5% of generation to either cause. Today, only a fifth of assets remain in that cluster.
The rest have split along two distinct axes:
- Queensland and South Australia assets are stretching along the economic axis, as negative prices become deeper and more frequent.
- New South Wales and Victoria assets are climbing the network axis, as grid constraints bind more often.
Notably, every asset with more than 5% network curtailment sits in NSW or Victoria - network risk in the NEM is now a distinctly regional phenomenon.
What this means for solar developers and investors
Economic price forecasting alone is no longer sufficient for underwriting NEM solar projects. Network studies now need equal weighting in revenue modelling. Assuming a flat export limit - rather than modelling dynamic network constraints - can lead to significantly overestimated project revenues, particularly in NSW and Victoria.
Getting both sides right - dynamic network limits alongside price risk - and understanding where storage can reduce exposure to either, is now essential groundwork before committing capital to a NEM solar project.
Get in touch with the team to explore modelling your renewable energy projects in Australia.
-
FAQ
What's the difference between economic and network curtailment?
Economic curtailment occurs when an asset declines to sell because the price is below its threshold. Network curtailment occurs when physical grid constraints cap how much available power can be exported, regardless of price.
Which NEM region has the highest solar curtailment?
South Australia currently has the highest total curtailment, at 42% of available generation, driven almost entirely by economic curtailment from negative pricing.
Which region has the highest network curtailment?
New South Wales, with approximately 11% of available generation curtailed due to network constraints over the last 12 months.
How has NEM solar curtailment changed since 2020?
Curtailment has increased substantially across every mainland NEM region. NSW has seen the sharpest relative increase, with total curtailment up sixfold.


