Can Football Stadiums Cut Energy Costs with Solar and BESS?

With the Football World Cup kicking off this week, I thought it was the perfect excuse to put Gridcog to the test on a real-world energy problem - analysing the load profile of a stadium similar to those hosting each of the 104 games.
Why are stadiums an interesting energy problem?
Stadiums turn out to be a highly interesting onsite generation and storage problem, and not just because the roofs are enormous. A few things make them stand out:
- Demand is incredibly uneven: A sold-out football match or a music concert is a vastly different profile from a non-event day during the week.
- Event times collide with the grid's tightest hours: An evening kick-off can land squarely in the peak demand window, piling load on the system when it can least afford it, and pushing the site's costs up with it.
- There's plenty else to electrify: Tens of thousands of fans arriving by car could be a major EV charging opportunity, and another reason onsite flexibility starts to pay.
That same volatility is what makes a stadium a tricky and interesting use case to model. The load is lumpy and calendar-driven rather than smooth, so the value of solar and storage depends heavily on when events fall and how they line up with prices and network peaks.
The Wembley Stadium Model
So I built a project in Gridcog, using Wembley Stadium (London, UK) as our example site, to see how the economics shift as you add renewables and storage.
Scenario 1 - Full grid connection: The baseline. The stadium’s demand profile was generated using a 4 MW peak assumption, and estimating 40 major events per year, to produce a synthetic load profile. Being fully grid-connected works, but those match-day import spikes are expensive, and every event day leans hard on the grid at exactly the wrong moment.
Scenario 2 - Add solar: Wembley’s roof is 11 acres with 4 acres being retractable. Assuming 45-60% of the fixed 7 acres is usable for PV (and a density of 180-200 W/m^2), this allows for 2.7-4.0 MW DC of solar. This trims the annual import bill by meeting a portion of demand, but it does little for the marquee problem: a floodlit evening kick-off happens long after the sun has gone down.
Scenario 3 - Add a battery (and expose the site to electricity markets with P415): Pair the solar with a 3 MW / 6 MWh BESS and the picture changes. On event days the battery roughly halves the import load, cutting peak draw and bringing lifetime cost down. Crucially, on the non-event days a year the asset isn't sitting idle: it trades in wholesale and ancillary markets, increasing earnings and turning a cost centre into something closer to a revenue line.
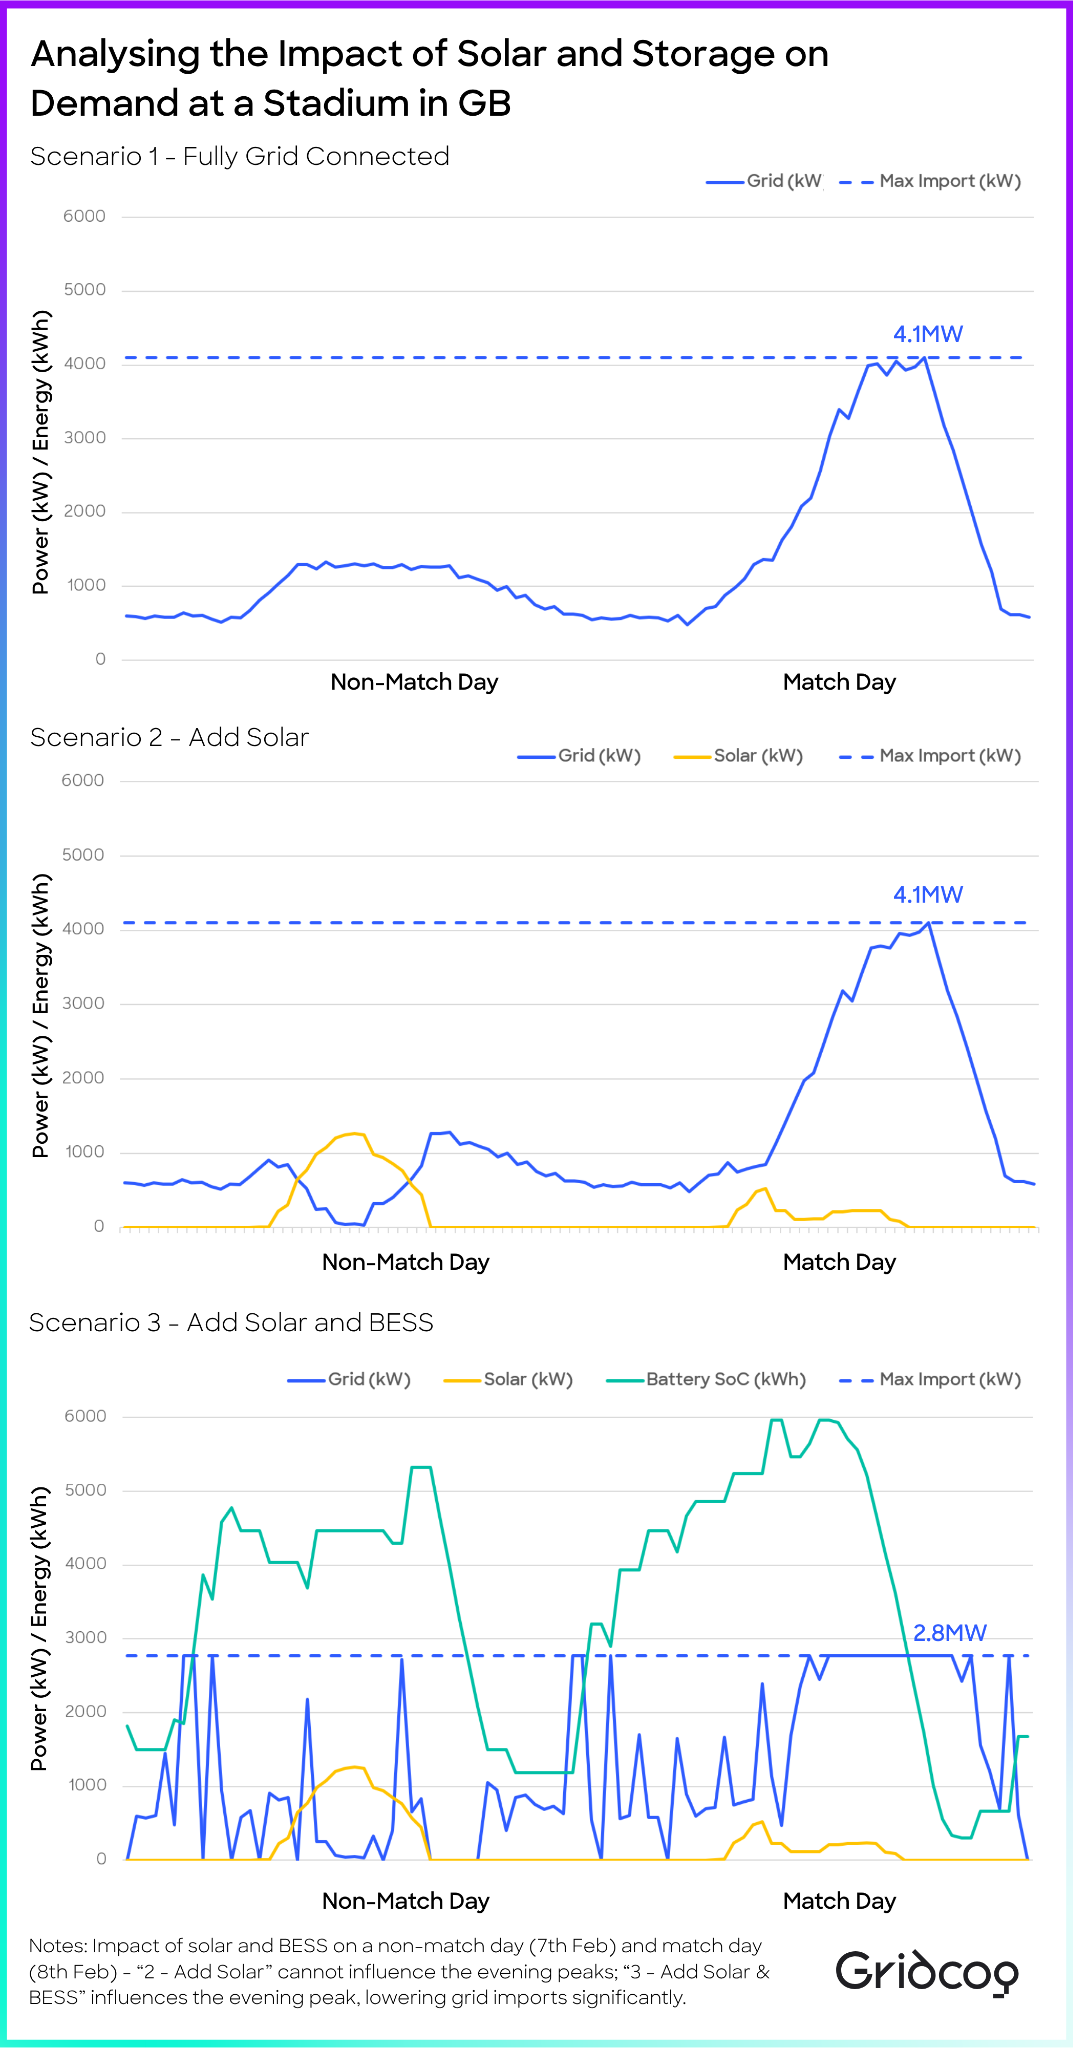
What the figure above shows is that being fully grid-connected works, but it leaves the site fully exposed on the days that matter most. Evening kick-offs land in the late-afternoon peak, roughly 16:00 to 19:00, exactly when wholesale prices and red-band distribution charges are at their daily highest. So the 4.1 MW match-day spike arrives at the most expensive moment of the day, costing far more per MWh than the same energy drawn overnight. Consider this across approximately 40 events a year and the import bill is dominated by a handful of very pricey hours. The introduction of solar alone did not help, but the combination of solar and BESS very much did, lowering the peak from 4.1 MW to 2.8 MW.
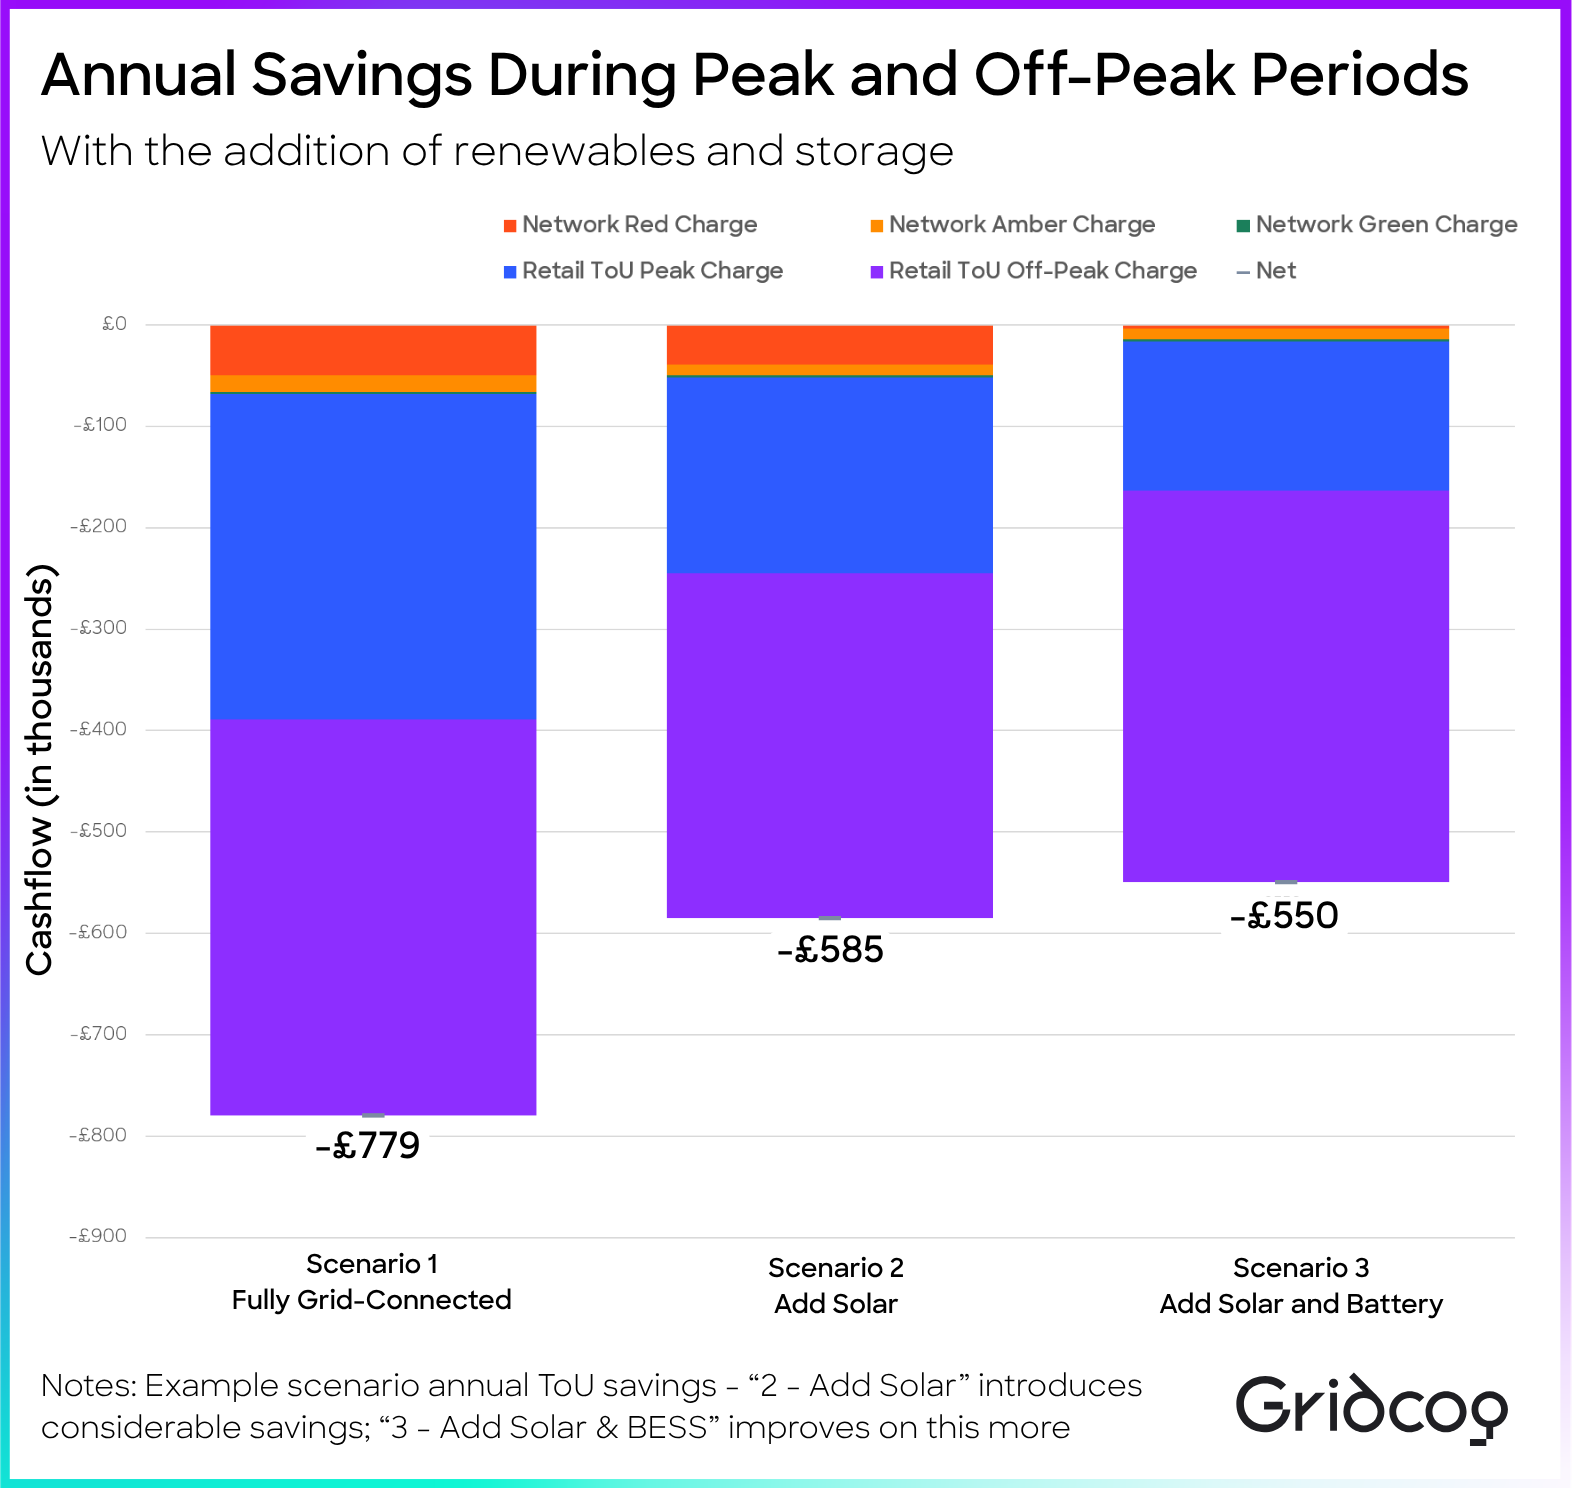
The figure below summarises the annual savings in the peak and off-peak periods. The introduction of renewables and storage has a marked impact on time of use (ToU) cost savings.
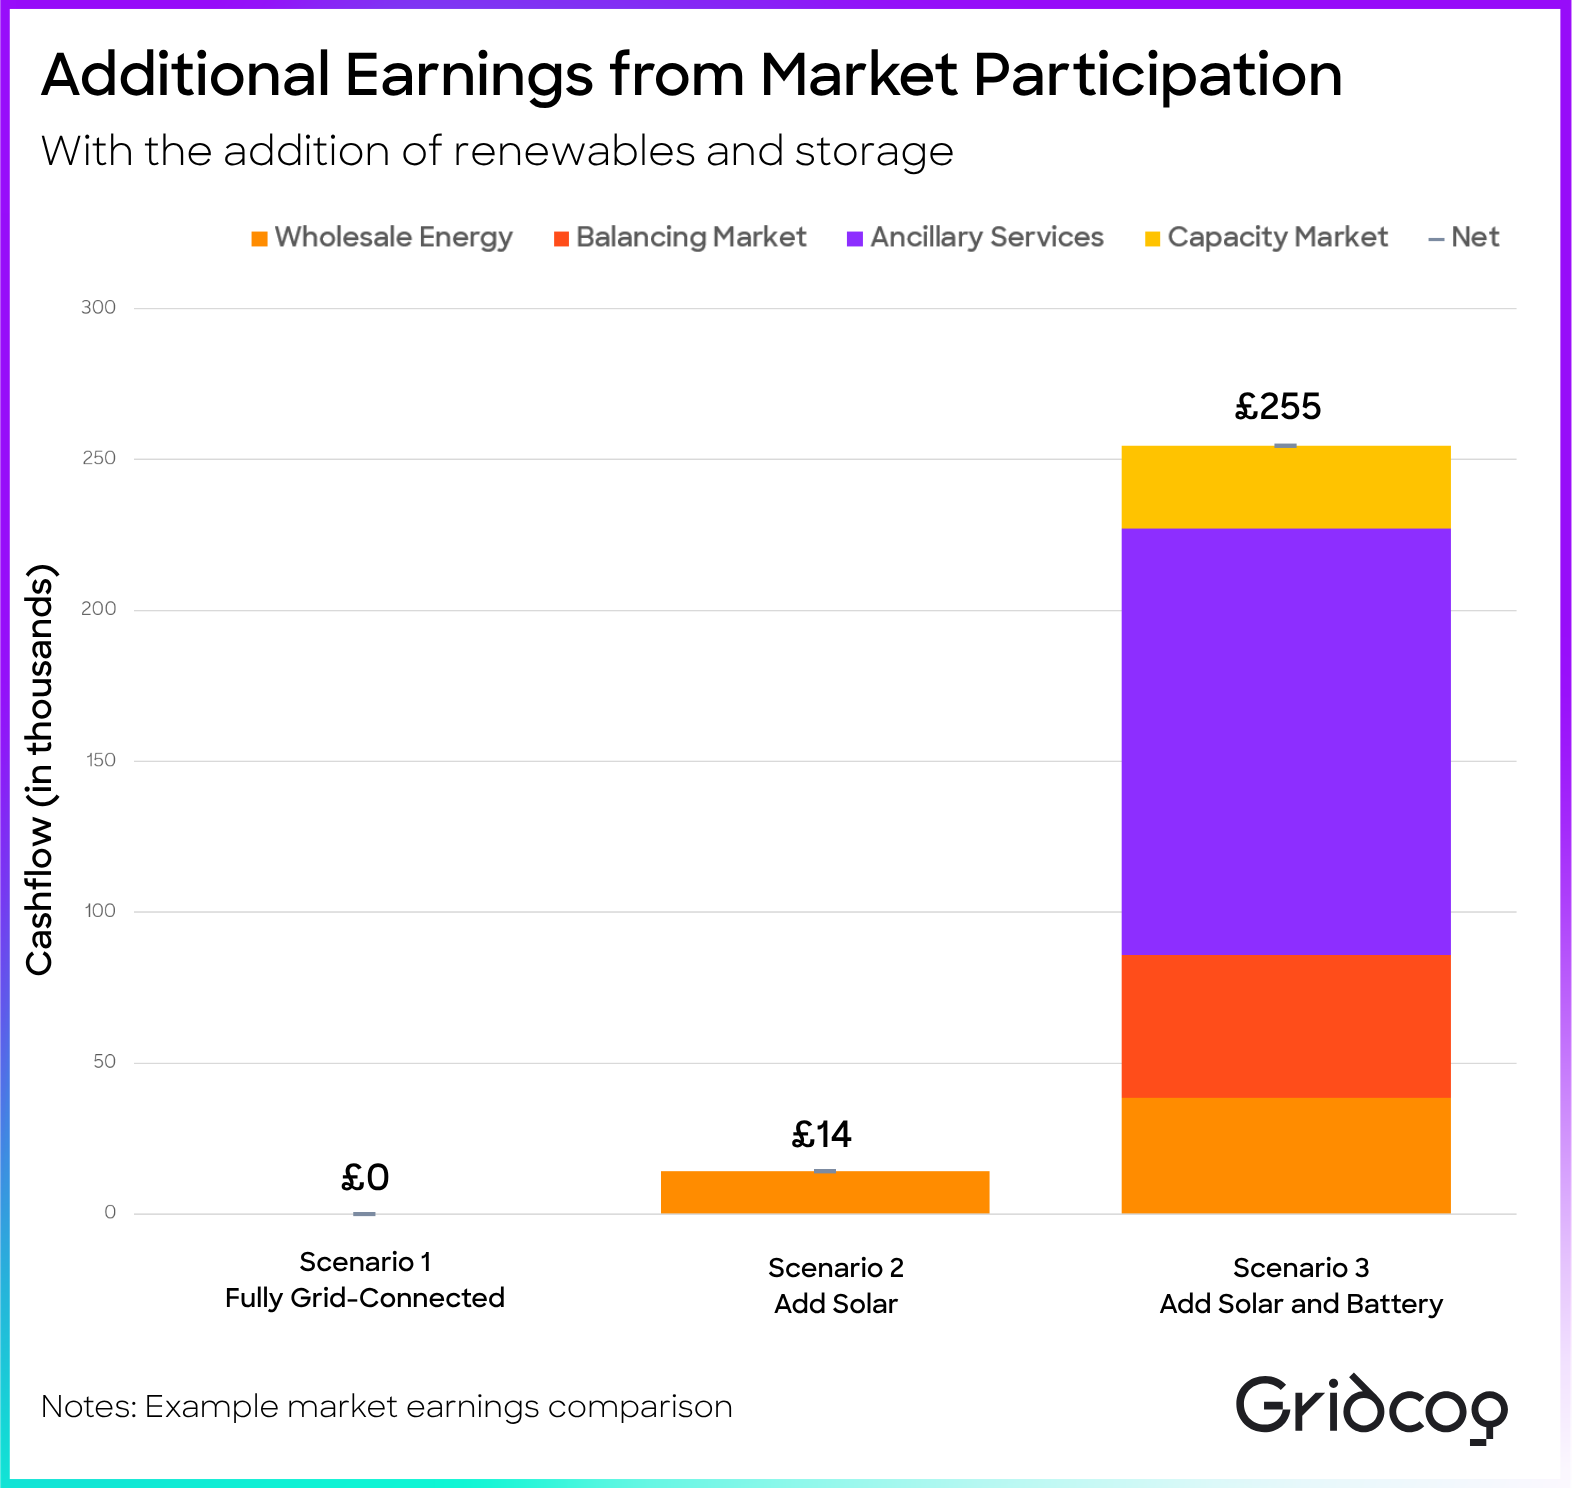
Over and above the savings resulting from renewables and storage (summarised in the figure above), additional earnings from participation in the wholesale (via P415), ancillary and capacity markets on non-event days further improves the economics. Scenario 2 sees additional wholesale earnings of £14,000 per annum through wholesale export, and Scenario 3 sees additional market earnings of £254,000 per annum through different revenue streams, improving the investment case and returns. These earnings are summarised in the figure below.
So how about in the USA?
The use case investigated here for Wembley stadium is no one-off. Look at this summer's World Cup: the AT&T Stadium in Dallas hosts nine matches between 14 June and 14 July, including a semi-final, and they fall right inside ERCOT's summer 4CP (Four Coincident Peaks) window, i.e. the period when grid peaks are most likely and transmission cost exposure is at its highest. In Texas, a single 15-minute system peak in each of June, July, August and September sets a large slice of the year's transmission charges, so a packed stadium drawing hard on a sweltering July afternoon is about the worst possible place to be exposed.
Who’s already doing it?
Adding renewables and storage to stadiums is a fascinating challenge, and the clearest proof it works is already up and running. Arsenal installed a 2MW/2.5MWh battery at the Emirates, the first at a UK football ground, built with Pivot Power and Downing. It can run the stadium through a full match and, between fixtures, earns its keep through wholesale trading and frequency response, while shaving peak charges. Over in Paris, the Champions League winners PSG have dabbled too, though their 48 rooftop solar panels powering the kitchens show just how far most clubs still have to go.
Why isn’t every ground doing this?
This opportunity is not isolated to football stadiums. So why isn't every ground doing this? We know grid connections can often be a barrier as well as the upfront cost of capital. In our model, the football stadium owned the assets, however there are other commercial models that can be considered and modelled in Gridcog, such as PPAs which are evolving to include other technologies. Other revenue and savings such as EV charging infrastructure, which Wembley already has.
Get in touch if you are interested in modelling microgrids and other sites with multiple technologies.