

Technologies

Wind farm modelling software

Wind turbines generate electricity from the kinetic energy of wind, in utility-scale wind farms and co-located with load in behind-the-meter deployments. Gridcog models front-of-meter and behind-the-meter wind turbines, large and small, with site wind resource data and a variety of commercial models, including power purchase agreements (PPAs).

How does Gridcog model wind turbines?

Gridcog can model front-of-meter and behind-the-meter wind turbines, large and small, along with a variety of commercial models, including power purchase agreements (PPAs). Easy-to-use parameter forms make it simple to configure your wind turbine projects, and to test wind generation as an option within your next energy project.

What wind resource data does Gridcog use?

Gridcog integrates a global database of wind resource data. Just set the location of your site, information on the surrounding terrain and the size options you want to model, and Gridcog will do the rest, simulating the expected output of your wind generation system. If you don't want to use our built-in power curves, you can also integrate external modelling of wind generation from specialist tools into your Gridcog energy project model.

What you set for a wind farm in Gridcog:

  • Location: wind speed and direction for the site, from Gridcog's built-in weather data
  • Terrain: a wind shear setting that scales wind speed from 10 m up to hub height
  • Turbines: the wind farm's total size and individual turbine capacity; hub height follows from turbine capacity
  • Power curve: a generic curve representing typical modern turbines
  • Losses: one setting covering availability, electrical, wake, environmental and curtailment losses
  • External data: output from specialist wind tools or an operating wind farm, uploaded as an externally modelled asset

Can you model wind with battery storage and co-located loads?

Yes. Gridcog makes it simple to model hybrid projects that integrate wind generation with battery energy storage, and supports solar generation and co-located loads such as hydrogen production or high-capacity EV fleet charging. The model can co-optimise the controls of all co-located resources, so you get a comprehensive view of your project's revenue opportunities.

Co-located battery storage

How does Gridcog model economic curtailment of wind?

By turning output down when generating would cost more than it earns. Many power grids with high levels of intermittent renewable generation are seeing more negative pricing events. Your Gridcog project model can include fully optimised economic curtailment of your generation system. It takes into account the revenue from environmental certificates and the potential network costs of importing energy from the grid for any co-located loads or storage, which may mean it is still optimal to generate during negative price events.

How do you model network curtailment of a wind farm?

Upload a curtailment schedule in an alternative project scenario. If the system operator could curtail your wind farm because of network congestion, this shows the economic risk that curtailment presents to your project, along with the opportunity to manage that risk by co-locating storage or load with your wind assets.

Assessing a wind farm or a hybrid project?

Model your wind project in Gridcog

How much Irish wind is dispatched down?

Dan Lehmann

Senior Energy Analyst

A rising share. All-island wind constraints, where the network can't carry the energy to where it's needed, rose from 7.7% in 2019 to 15.3% in 2026, and system-wide curtailment comes on top. Gridcog Senior Energy Analyst Dan Lehmann looked at what that means for co-locating storage with wind.

MeasureFigure
All-island wind constraints7.7% in 2019; 15.3% in 2026
North-west of Ireland, Q2 2026Constraints hit 18.2% for 390 MW of wind
Cause of wind curtailment, 2025Around 84% from ‘high frequency’ requirements, with the System Non-Synchronous Penetration (SNSP) limit, capped at 75%, accounting for almost all the rest
Compensation under RESS 1 and 2Only where curtailment exceeds 10% in two consecutive years, and only on the portion above 10%
Sharing a connectionSince the CRU's April 2026 decision, one contracted maximum export capacity (MEC) can be shared between co-located generation and storage, but the battery can't charge from the renewable generation

Which teams model wind in Gridcog?

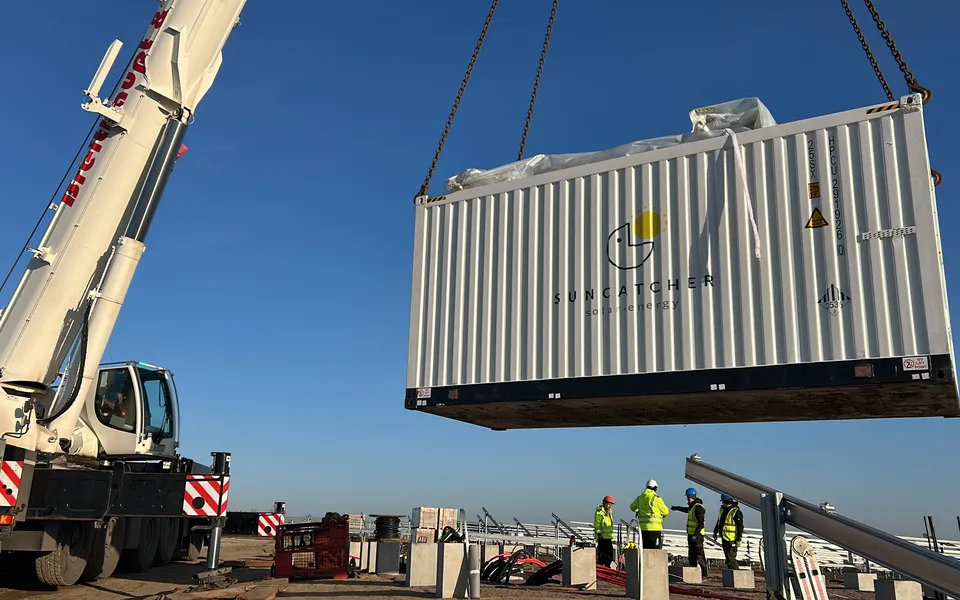
A crane lifting a battery storage container on a solar farm construction site
EPC contractor for battery projects within the SUNCATCHER Group, a developer and independent power producer (IPP), Germany

SUNCATCHER Engineering

Models batteries co-located with existing or new solar and wind plant, including a project that combined wind, solar, battery storage and grid charging rights.

‘Modelling the interaction between all those technologies is extremely complex. Gridcog allowed us to handle that complexity properly and deliver robust results.’
Lucas Dziadek, Project Manager

Who models wind in Gridcog?

Wind developers and independent power producers (IPPs), investors, energy majors and large energy users with on-site wind.

Frequently asked questions

The site's location, a terrain or wind shear setting, the wind farm's total size and individual turbine capacity, and a losses assumption. Add the grid connection, any battery, solar or load on site, and the commercial arrangements, such as a PPA or merchant exposure. If you already have yield data from a specialist tool, upload that instead of using Gridcog's built-in wind model.

Yes. Upload a time series of wind output from specialist modelling tools, or from an operating wind farm, as an externally modelled asset. Gridcog's built-in model uses one generic power curve representing typical modern turbines, so a specific turbine's power curve comes in through that external yield data, once you've chosen a turbine and run a detailed yield study.

As part of a single losses setting, rather than turbine by turbine. The setting covers turbine availability, electrical losses, wake effects, turbine performance, environmental losses and curtailment together. For a detailed wake study, run it in a specialist tool and upload the resulting output to Gridcog.

Yes. Because of low capacity factors, around 67% of wind and 87% of solar grid capacity often goes unused, which leaves room for other assets on the same connection. Gridcog models several assets on one connection, applying the shared export limit and co-optimising how they dispatch. More on co-located battery storage.

They can make generating cost money. With economic curtailment, Gridcog turns wind output down when exporting would cost more than it earns, taking account of export charges and import costs for co-located loads. Certificate income can be set up as a tariff so curtailment starts only when the combined price turns negative, for example with large-scale generation certificates (LGCs) in Australia's NEM.

Yes. Model fixed-price PPAs, contracts for difference (CfDs) and subsidies on the wind farm's output, including clauses that knock out during negative prices and how many negative intervals trigger them. Compare them with merchant exposure in the same project. Read how to model offtake contracts and subsidies for co-located projects.

Request a live demo

Model your wind project in Gridcog

Request a demo and we'll show you how Gridcog models your wind farm, with storage, contracts and curtailment.

The team behind Gridcog

Fabian Le Gay Brereton, Chief Executive Officer and Co-Founder of Gridcog

Fabian Le Gay Brereton

Chief Executive Officer & Co-Founder

Previously co-founded Greensense, acquired by ERM Power (now Shell Energy).

Pete Tickler, Chief Product Officer and Co-Founder of Gridcog

Pete Tickler

Chief Product Officer & Co-Founder

Co-founded Greensense and led digital innovation at ERM Power (now Shell Energy).

Genna Boyle, Chief Commercial Officer and Head of EMEA at Gridcog

Genna Boyle

Chief Commercial Officer & Head of EMEA

More than 10 years in energy strategy, trading and renewables, with senior roles at Battery Optimiser and Limejump.