

01
Virtual power plants
Virtual power plants (VPPs) are distributed portfolios of energy resources, aggregated by a VPP aggregator to provide wholesale energy market services.
Eleven technologies, from generation and storage to the loads that use energy. Each has its own technical settings in Gridcog, and any of them can share a site or grid connection with the others.
Generation01
Solar PV systems generate electricity directly from solar irradiance, and their output depends on location, local weather, module and inverter characteristics, orientation and tilt. Gridcog simulates that output with site weather data, then values it against curtailment, negative prices and network tariffs, at utility scale or on a commercial site.
Proof

Daria Ekimova
Senior Energy Analyst
Gridcog Senior Energy Analyst Daria Ekimova modelled a 100 MW solar project under three German curtailment schedules of 669 to 1,160 hours a year, alone and with a co-located battery (June 2026).
Generation02
Wind turbines generate electricity from the kinetic energy of wind, in utility-scale wind farms and co-located with load behind the meter. Gridcog uses a global wind resource database and built-in power curves, or your own external wind modelling, and can co-optimise wind with batteries, solar and co-located loads.
Proof

Dan Lehmann
Senior Energy Analyst
Constraints hit 18.2% for 390 MW of wind in the north-west of Ireland in Q2 2026, figures Gridcog Senior Energy Analyst Dan Lehmann used to assess co-location in Ireland (September 2026).
Storage03
Batteries store energy and discharge it later. They connect to the transmission or distribution grid, sit alongside generation and load in microgrids and private wire developments, or work behind the meter. Gridcog models dispatch, revenue stacking across wholesale, ancillary, balancing and capacity markets, and degradation, warranties and repowering.
Proof

Scott Bosman
Senior Energy Analyst
Two-hour price spreads in Australia's National Electricity Market (NEM) fell more than 70% year on year in autumn 2026. Gridcog Senior Energy Analyst Scott Bosman looked at how that is squeezing battery revenues to record lows (May 2026).
Storage04
Co-located and hybrid projects put a battery on the same grid connection as a solar or wind farm, as a retrofit or on a greenfield site. Gridcog models the shared connection and any existing power purchase agreement (PPA) or subsidy, including negative-price clauses, and autosizes the battery against the site's prices and costs.
Proof
Daria Ekimova
Senior Energy Analyst
Daria Ekimova modelled a 10 MW, 2-hour battery co-located with a 12 MWp solar asset to value Germany's MiSpeL rules for co-located batteries (October 2026).
Storage05
Long duration energy storage (LDES) discharges for longer than the one to four hours typical of lithium-ion batteries; pumped hydro, for example, can run for up to 10 hours. Gridcog compares battery durations on forward price projections, so you can see when longer duration earns its extra cost.
Proof

Pete Tickler
Chief Product Officer
Gridcog Chief Product Officer Pete Tickler modelled a 100 MW battery in New South Wales on three price projections. Spreads held for 4 and 8 hours, and sometimes 12 (the age of long(er) duration BESS, February 2025).
E-mobility06
Public or on-demand EV charging is offered on-street, in car parks and at forecourts, often with high-powered DC fast chargers. Gridcog models charger use probabilistically, with the grid connection, tariffs, on-site solar and battery storage, to build the business case for a charging hub.
Proof
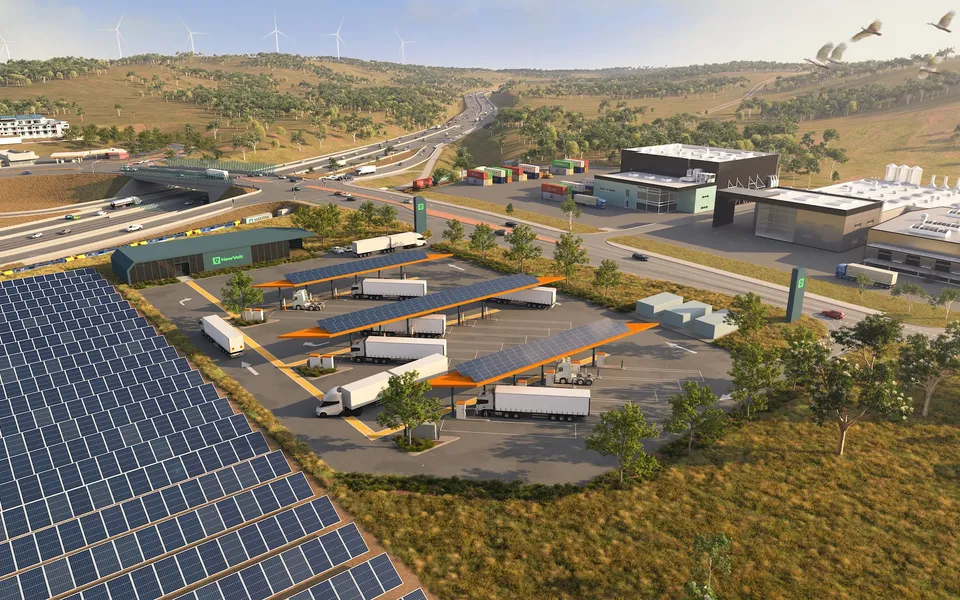
NewVolt used Gridcog to check that charging capacity, battery storage and grid connections were right-sized for its Melbourne truck charging hubs.
E-mobility07
Fleet charging happens at depots, homes and businesses, with flexibility in when vehicles charge. Gridcog models vehicle schedules, charger limits and smart, bi-directional or impatient charging against the depot's grid connection and supply costs.
Proof
Pete Tickler
Chief Product Officer
Smart charging cut a depot fleet's energy supply costs by over 63% compared with impatient charging in Pete Tickler's analysis of EV fleet charging strategies (January 2025).
E-mobility08
Vehicle-to-grid (V2G) lets a parked electric vehicle export energy back to a building or the grid. Gridcog models V2G chargers alongside smart charging, so you can compare the cashflows of simple charging and V2G for fleets, car parks and homes.
Proof

Catalina Villaro
Senior Energy Analyst
Gridcog Senior Energy Analyst Catalina Villaro compared simple charging with V2G on 7 kW chargers to model V2G for long-stay parking in Australia (January 2026).
Flexible loads09
As grids take more solar and wind, demand has to become more flexible about when it uses electricity. Flexible loads may be self-dispatched or centrally controlled by system operators. Gridcog models load shifting, wholesale demand response and flexibility revenue for single sites and portfolios.
Proof

Genna Boyle
Chief Commercial Officer
In Gridcog Chief Commercial Officer Genna Boyle's P415 example, a 500 kWh battery saved about £6,600 a year on supply and network charges. That alone wouldn't justify around £175,000 of capital cost (June 2025).
Hydrogen10
A hydrogen electrolyser and its associated plant for compression, storage and transport, often with integrated wind or solar generation, or direct on-site hydrogen consumption. Gridcog models electrolyser efficiency, renewable supply, grid import and storage, and works out the levelised cost of hydrogen (LCOH).
Generation11
Fuel-powered generators, or gensets, provide resilience within microgrids and behind the meter, or peak generation and contingency reserve within the wider grid. They can run on gas, diesel, biofuel or hydrogen, and Gridcog models them alongside solar, batteries and grid supply.
Proof
Pete Tickler
Chief Product Officer
Pete Tickler modelled a 100 MW UK data centre on a 50 MW grid connection: solid oxide fuel cells against gas gensets cut 20-year opex, but capex and slow ramping weigh against them (May 2026).
Developers, investors, energy majors, suppliers, large energy users, data centres, fleet operators, consultants, property owners, networks and technology providers all model these technologies in Gridcog, each for a different decision.
Gridcog models 40+ electricity markets, including Great Britain, Ireland, Germany, Spain, Australia and New Zealand. Market rules, settlement logic, network tariffs and price data sit in the Gridcog Library, so a project built for one market can be rerun in another.
Five customers, five kinds of project, each with a published case study.
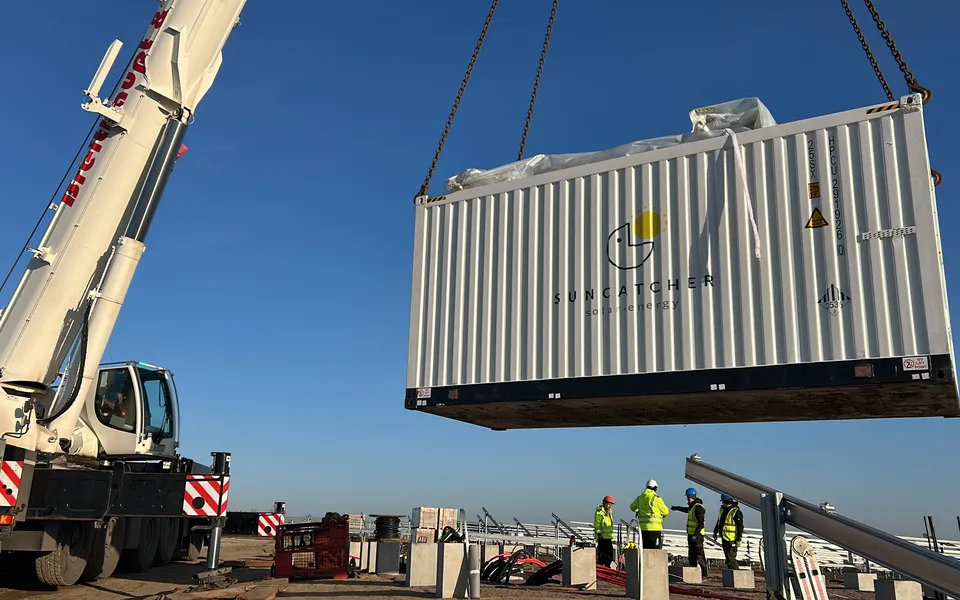
Models standalone batteries and solar plus battery projects with offtake structures and subsidy schemes, and modelled seven utility-scale projects in Gridcog in one month.
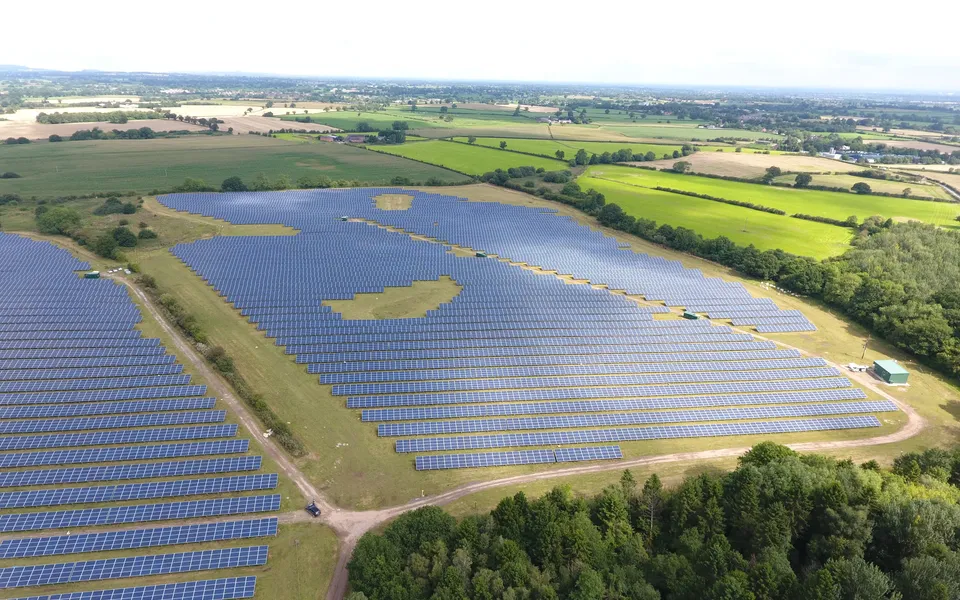
Models solar, battery storage, wholesale trading and capacity market income for commercial clients, and estimates around £27m of investment secured over 12 months.
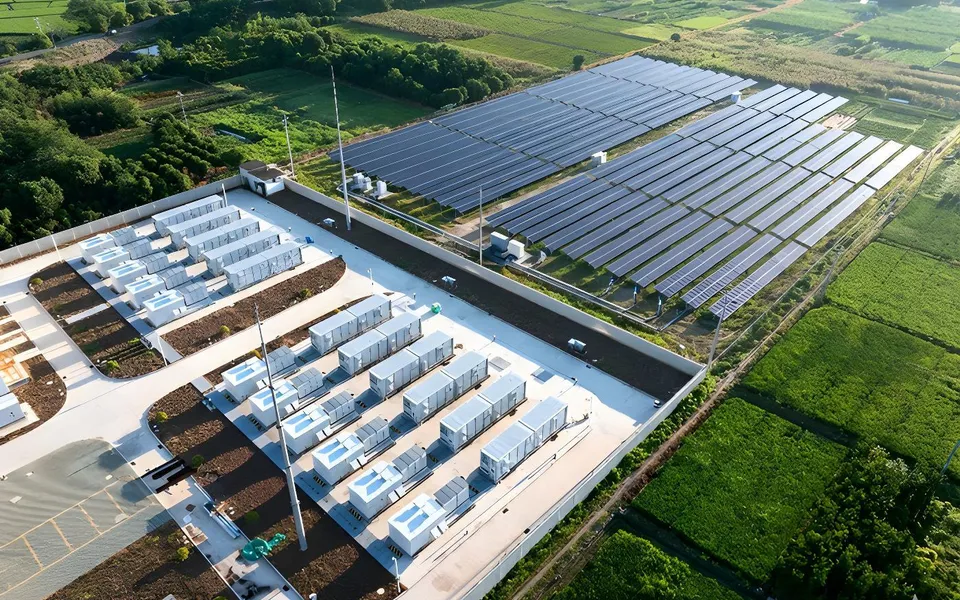
Uses Gridcog for bankable BESS revenue assessments, including a 53 MWp solar and 120 MWh battery project in Saxony-Anhalt.
Sized charging, battery storage and grid connections for the Melbourne Electrified Freight Network's three 2–4 MW truck charging hubs.
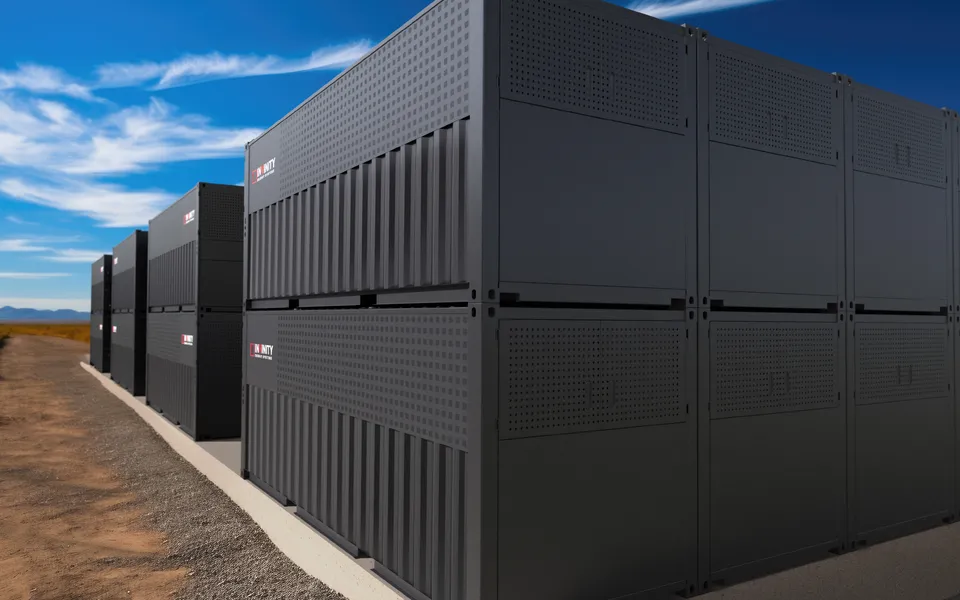
Uses Gridcog to model front-of-meter and behind-the-meter revenue for its customers' projects.
‘With Gridcog, it's automated: you get a clear report to send to the customer.’
Request a live demo
Request a demo and we'll show you how Gridcog models the technologies in your project.
The team behind Gridcog

Fabian Le Gay Brereton
Chief Executive Officer & Co-Founder
Previously co-founded Greensense, acquired by ERM Power (now Shell Energy).

Pete Tickler
Chief Product Officer & Co-Founder
Co-founded Greensense and led digital innovation at ERM Power (now Shell Energy).

Genna Boyle
Chief Commercial Officer & Head of EMEA
More than 10 years in energy strategy, trading and renewables, with senior roles at Battery Optimiser and Limejump.

