
Technologies

Battery energy storage system (BESS) modelling

A battery energy storage system (BESS) stores electricity and discharges it later, earning from price spreads, ancillary services and capacity payments, or by cutting energy bills. Gridcog models how a battery dispatches and earns, interval by interval, under each market's rules, with degradation and warranties. You can size it and test its revenue before you invest.

  • Two-hour price spreads in Australia's National Electricity Market (NEM) fell by over 70% year on year in autumn 2026, and batteries earned over 60% less than in autumn 2025.

  • A simplistic forecast overstated frequency control (FCAS) revenue 9.5 times for a utility-scale battery in Queensland, and 12.3 times for a behind-the-meter one, compared with a realistic Gridcog model.

  • Gridcog's modelled Queensland battery came within 2.9% of a real battery's 2024 revenue.

What is a battery energy storage system (BESS)?

A battery energy storage system (BESS) stores electricity and discharges it later. Batteries connect directly to the transmission or distribution grid, sit alongside generation and load in microgrids and private wire developments, or work behind the meter at a business or home. Lithium-ion is the most common chemistry, alongside flow, sodium and other batteries.

How big is a battery?

A battery's size is more than its storage capacity. These five measures decide what it can do and which markets it suits.

MeasureWhat it tells youIn practice
Energy capacity (kWh or MWh)How much energy the battery can storeLike the size of a water tank
Power rating (kW or MW)The fastest it can charge or dischargeLike the width of the pipe that fills and empties the tank
Duration (hours)How long it can discharge at full power: energy capacity divided by powerA 4 MWh battery rated at 1 MW has a 4-hour duration
C-rateHow fast it charges or discharges relative to its capacity1C is a full charge or discharge in one hour; 0.5C takes two hours
Lifetime throughput (MWh or cycles)How much energy it can deliver over its life as capacity degradesManufacturers often set end of life at 60% or 70% of original capacity

How does a battery earn revenue?

By moving energy in time and by selling flexibility. Front-of-meter batteries trade wholesale price spreads and earn from ancillary, balancing and capacity markets. Behind-the-meter batteries can also cut a site's energy bills, add usable capacity to a constrained grid connection and keep critical loads running in an outage.

Value streamHow it worksWhere it applies
Wholesale arbitrageCharge when prices are low and discharge when they're high, across day-ahead and intraday marketsFront-of-meter, and behind-the-meter with market access, such as P415 in Great Britain
Ancillary servicesHold capacity ready to respond to grid frequency, such as FCAS in the NEM or frequency containment reserve (FCR) and automatic frequency restoration reserve (aFRR) in EuropeMostly front-of-meter; these markets are shallow and saturate as more batteries connect
Capacity marketsPayments for being available at times of system stress, de-rated to the share of capacity counted as firm at peakGreat Britain, Poland, Belgium and Italy; Spain and Germany are setting up schemes
Bill savingsTariff arbitrage, solar self-consumption and demand charge managementBehind-the-meter
Network capacityKeeps a site's demand under its grid connection limit, so new load can connect without an upgradeBehind-the-meter
Backup powerKeeps critical loads running when the grid supply is interruptedBehind-the-meter

How does Gridcog model a battery?

Interval by interval, against the prices, market rules and contracts the battery will face. Gridcog co-optimises how the battery charges, discharges and offers capacity across every market it can access, so the revenue stack reflects the trade-offs between them.

01

Dispatch and revenue stacking

Model wholesale, ancillary, balancing and capacity revenues together, using Gridcog benchmarks or your own assumptions. With Market Price Forecast Uncertainty, the battery dispatches on a price forecast and settles on actual prices, so forecast error shows up in the results.

02

Market rules

Reflect each market's rules: bid rounding, headroom and footroom, activation pricing, offers accepted, energy utilisation and churn between wholesale markets. Test upcoming regulatory changes in a separate scenario.

03

Sizing and autosizing

Size a battery by storage and duration or by power and duration, or let Gridcog's autosizing find the size with the highest net cashflow. Compare durations side by side in alternative scenarios.

04

Degradation, warranties and repowering

Set round trip efficiency, depth of discharge and daily cycle limits. Degrade capacity by time or by cycles against a warranty schedule, add a cycling cost to the optimisation, and model augmentation or repowering with capex and opex assumptions.

05

Grid connections

Apply import and export limits, dynamic connections, ramp rates and AC or DC coupling. Put the battery on the same connection as solar, wind or a site's load.

06

Offtake and commercial structures

Model power purchase agreements (PPAs), contracts for difference, floors, collars and swaps, add each stakeholder, and compare cashflows, internal rate of return (IRR) and net present value (NPV). Download full reports for investment and approval processes.

Modelled in Gridcog

Where does a battery earn more: Queensland or Victoria?

In 2024, Queensland. Gridcog Senior Energy Analyst Scott Bosman modelled the same merchant battery in both NEM regions, and the Queensland battery earned over A$130k per MW more over the year. Location can change a battery's revenue case significantly.

Two hypothetical merchant batteries, Australia's NEM, 2024

Set-up
One battery in Queensland and one in Victoria, modelled on 2024 wholesale and FCAS prices
Result
Queensland earned over A$130k per MW more, with monthly revenue peaking at nearly A$43k per MW in May
Wholesale arbitrage
About A$80k per MW of the gap, because Queensland's spot prices were more volatile
FCAS
Queensland had more high-priced frequency control events
Accuracy check
The Queensland model came within 2.9% of a real battery's 2024 revenue

Sizing a battery or testing its revenue stack?

Model your battery project in Gridcog

Why do simple battery revenue forecasts overstate income?

Fabian Le Gay Brereton

CEO

They assume every MW of a battery can be offered into ancillary markets and every offer is accepted. Those markets are shallow and saturate quickly as batteries connect. In Queensland, a simplistic forecast overstated FCAS revenue 9.5 times for a utility-scale battery and 12.3 times for a behind-the-meter one, compared with a realistic Gridcog model.

A realistic battery revenue model includes:

  • Sensible assumptions on capacity registered and accredited for each market
  • Short-term forecasting uncertainty for energy and ancillary prices
  • Co-optimised dispatch across energy and ancillary markets, with the opportunity cost of holding capacity back
  • Headroom and footroom, so the battery can deliver a service for its full enablement period
  • Bids rounded to whole MW where the market requires it
  • Realistic shares of offered capacity accepted, and how that may fall over time
  • Realistic energy use when enabled capacity is dispatched

How accurate are BESS FCAS revenue forecasts? Lessons from Australia's battery markets

How do you contract a battery's revenue?

Catalina Villaro

Senior Energy Analyst

Usually with a swap or a floor. Lenders want part of a battery's revenue contracted, but a battery earns from spreads it chooses when to trade, so contracts built for solar or gas plants don't fit. Gridcog Senior Energy Analyst Catalina Villaro compared the main structures (July 2026).

StructureHow it worksTrade-off
Tolling agreement (physical or capacity swap)The offtaker rents the battery's capacity and sets its dispatch, for a fixed paymentHigh revenue certainty and strict availability obligations, typically for four to seven years
Revenue swapSettles against the battery's own net revenue; the owner keeps control of dispatchAlmost no basis risk, but bespoke and hard to verify
Top-bottom spread (TBx)Settles against an index of the day's highest- and lowest-priced hoursMore liquid, but the owner carries the basis risk if the battery can't match the index
Floor or collarTops revenue up to a minimum; a collar adds a cap, often to fund the floorProtects the debt case and keeps most upside, with tenors of up to 15 years

In Gridcog, a financial day-ahead swap on a 100 MW, four-hour battery in Great Britain narrowed its monthly revenue range from £13,100–£22,500 per MW to £14,551–£17,304 per MW over the first quarter of 2027.

Battery storage offtake agreements: swaps, floors and bankability explained

Which battery teams use Gridcog?

Developers, independent power producers (IPPs), technical advisors and behind-the-meter specialists use Gridcog to size batteries and assess their revenue. Three of them have published how.

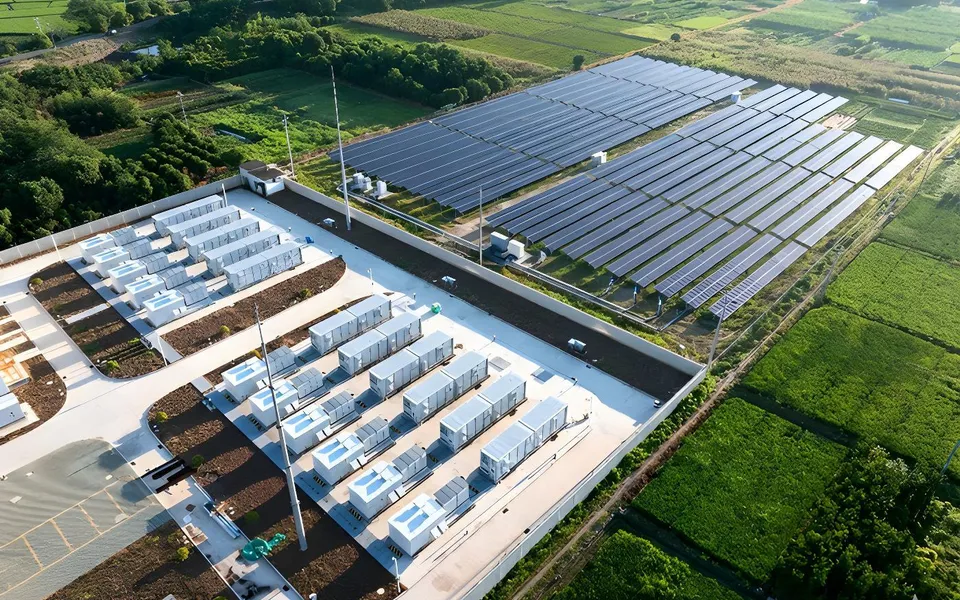
Battery storage containers beside a large solar farm
Technical consulting, Germany

meteocontrol

Runs BESS revenue assessments for standalone and co-located projects. Three to four BESS specialists use Gridcog as their main modelling environment, on several new projects every week.

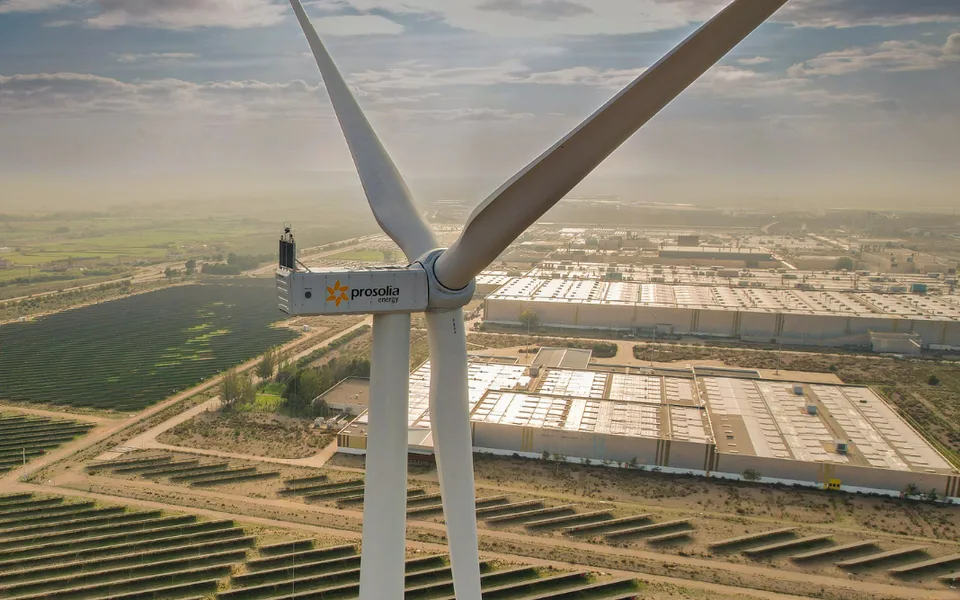
A wind turbine beside a large solar farm
Independent power producer, Spain, Portugal, France, Italy, Germany and Mexico

Prosolia Energy

Has modelled more than 200 projects in Gridcog, at least ten times faster than with in-house tools.

‘It's not a black box.’
Marc Kleindienst, Energy Solutions Engineer
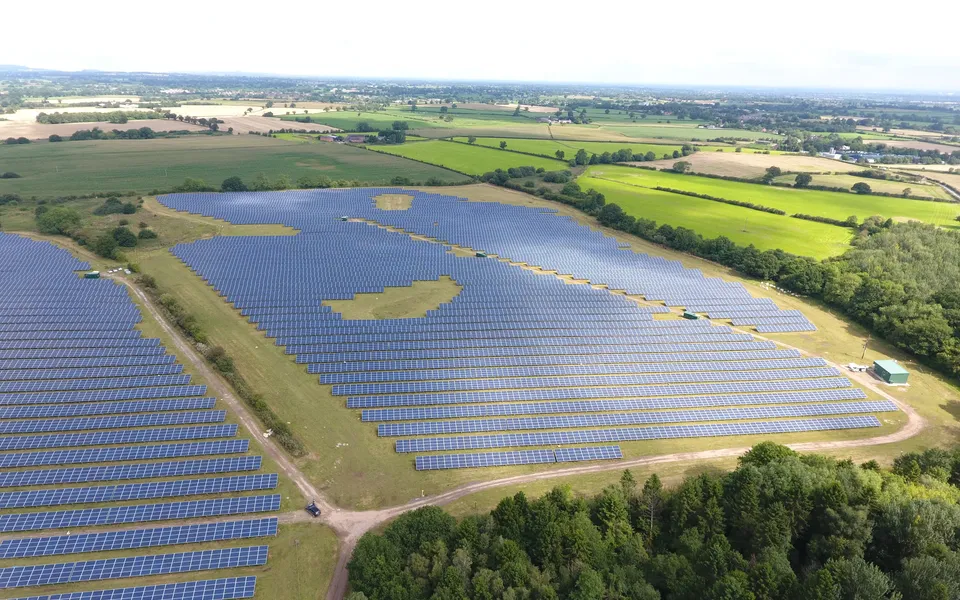
Aerial view of a solar farm in the UK countryside
Behind-the-meter solar and storage, UK

Sustain Commercial Solar

Has modelled around 400 MWh of battery storage across 50 sites in Gridcog, with wholesale trading, Capacity Market income and frequency response, and estimates around £27m of investment secured over 12 months.

Who models batteries in Gridcog?

Developers and IPPs, investors, energy majors, large energy users, consultants and battery technology providers.

Frequently asked questions

A front-of-meter battery connects to the grid on its own or with a solar or wind farm, often at transmission level, and earns from energy and grid markets. A behind-the-meter battery sits at a business or home alongside its load, typically 100 kWh to 5 MWh for a business. It cuts the site's energy costs and, where rules allow, earns from markets too. Gridcog models both.

It depends on location, markets and timing. In Scott Bosman's 2024 models, a Queensland battery earned over A$130k per MW more than the same battery in Victoria. In autumn 2026, NEM batteries earned over 60% less than a year earlier as spreads narrowed. Model the battery on its own location, prices and contracts, across several scenarios rather than one forecast.

Less than they were. Ancillary markets in Great Britain, Germany, Texas and Australia's NEM have seen steady revenue declines as batteries connected, because the markets are shallow. In June 2025, the NEM's new Frequency Performance Payments totalled only A$3.6m across the market. Most battery value now comes from energy price arbitrage, so model ancillary revenue with realistic acceptance rates.

Yes, where the market allows it. In Great Britain, P415 has let an aggregator trade a behind-the-meter battery in wholesale markets since November 2024. In Pete Tickler's model of a Maidstone supermarket, a 500 kWh / 250 kW battery saved £7,152 a year on bills alone, and generated £19,885 with P415 access, the Capacity Market and DNO flexibility services.

It depends on how hard it's cycled, its temperature and its age, which all wear down usable capacity. Manufacturers often set end of life at 60% or 70% of original capacity. Gridcog models time-based or cycle-based degradation against a warranty schedule, limits daily cycles, and lets you add capacity later to replace what's been lost.

Yes. Gridcog's battery asset represents lithium-ion, flow, sodium, solid-state and other chemistries, with settings for round trip efficiency, self discharge and degradation. Its flexible parameters can also represent other storage, such as flywheels and compressed air. See long duration energy storage (LDES) for longer-duration technologies.

We regularly benchmark Gridcog against real batteries in the market and set sensible defaults from that work. In Scott Bosman's 2024 benchmarking, the Queensland model came within 2.9% of a real battery's annual revenue. Historical GB and NEM prices in the Gridcog Library update daily via API. Compare your project with our benchmark projects.

Request a live demo

Model your battery project in Gridcog

Request a demo and we'll show you how Gridcog sizes a battery and tests its revenue stack.

The team behind Gridcog

Fabian Le Gay Brereton, Chief Executive Officer and Co-Founder of Gridcog

Fabian Le Gay Brereton

Chief Executive Officer & Co-Founder

Previously co-founded Greensense, acquired by ERM Power (now Shell Energy).

Pete Tickler, Chief Product Officer and Co-Founder of Gridcog

Pete Tickler

Chief Product Officer & Co-Founder

Co-founded Greensense and led digital innovation at ERM Power (now Shell Energy).

Genna Boyle, Chief Commercial Officer and Head of EMEA at Gridcog

Genna Boyle

Chief Commercial Officer & Head of EMEA

More than 10 years in energy strategy, trading and renewables, with senior roles at Battery Optimiser and Limejump.